|
Grandfather Economic Report series
Home & Contents | Summary | Reader
Feedback | What's New | Eye-opener
| E-mail
|
(a chapter of the Grandfather
Economic Report series with graphic presentation reviewing economic issues facing
today's generation compared to prior periods, on: Family Income, debt, savings; government
spending and size, education quality, social security, regulations, taxes, energy,
inflation, foreign trade and exchange, voter turnout, trust, celebration, and health
care/life expectancy)
Our nation has became more government-dependent than ever before
ITEM: When someone says, "the era of big government is
over" - -
You should ask, "compared to what?"
Then have them look at the following pictures -
and ask, "when will the era of big government be over?"
- a historic view with a most sobering comparison,
via dramatic color pictures you have never seen -
Many believe a small government sector is best, which was the clear intention of America's founding forefathers. (by government we mean the sum of U.S. federal and state & local governments). The question is how small is small? Is 10% of the economy to government enough? How about 20% - or 40% or 50%? Or, even more? Question: how much government dominance do you think our founders intended?
Stated in a different manner: How would you answer this question > "What share of our economy's national income should be controlled & dominated by federal, state and local government and its planners, and how much federal debt should be allowed in peace-time?"
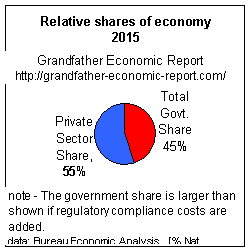
That is a very important question, which significantly impacts the economic future and freedom of our children - - compared to prior generations and to the intent of our nation's founding forefathers. Many will answer, "About 10% to 20% of the economy for spending, with near zero debt." But, today's government consumes more than twice that much - 45% of the economy by its spending, plus another 13% of the economy via its un-funded regulatory mandates - - leaving less than half of the economy to the free-market private sector. Additionally, federal government debt is now approaching $20 Trillion, 80% of which was created since 1990. It has not always been that way - only recently.
HERE'S WHERE WE ARE - 45% of our economy today is dependent
on government spending & control
 Several pictures show a core problem
- - the unparalleled expansion of government, whereby 45% of the economy
now depends on government spending - - causing shrinkage of the productive
private sector's share. Here's where we are.
Several pictures show a core problem
- - the unparalleled expansion of government, whereby 45% of the economy
now depends on government spending - - causing shrinkage of the productive
private sector's share. Here's where we are.
This pie chart approximates today's economy (measured by national income) - - divided into two (2) slices: the government sector vs. the private sector.
The red slice shows 45% of our economy depends on government (federal + state/local) spending of $6.5 trillion. The blue slice is the part (55%) of the economy left over to the free-market private sector that does not depend on government. (note: this chart only covers government spending, not also the costs of complying with government-mandated regulations which amount to another 13% of the economy- - the latter covered via a graphic at the bottom of this report).
The government (red) slice of this chart is derived by taking the sum of federal ($4 trillion, 28%) and state & local ($2.5 trillion, 17%) sums total government spending to $6.5 trillion or 45% of the economy's total national income, nation-wide, and dividing same by the total economy (as measured by its total national income reported by Dept. of Commerce, Bureau of Economic Analysis). The residual (blue) slice is the balance left to the private sector. (Note: this total govt. share of 45% of national income is approx. 42% of less reliable GDP)
Did our nation's founders, who planned for small and limited government, intend the America of their dreams to evolve where 45% of our economy is dependent upon government? Is 51% the economy controlled by government what Thomas Jefferson meant when calling for 'least government is best'?
Is such a large share dependent on government what we mean by 'small government'? Do we intend such for our children and grandchildren?
Is the future of their freedom & economic well-being at risk - compared to the past
and to what it could and should be?
You have a right to know. Let's explore with a few pictures. It may 'blow your mind'
to find how 'small' become 'huge'.
Coming up:
a neat view of history, with 3 simple pictures
- perhaps the most dramatic pictures of all
Socialism (some call it 'collectivism') is considered by some a dirty word. Some would call socialism 'un-American'.
Many economists (such as Nobel Prize winners F.A. Hayek, Milton Friedman and others) claim advanced collectivist societies of socialism, communism and fascism are similar words to describe economies too much dominated by government - that, as a society becomes more government-dependent due to expansion of same faster than the general economy expands, the free-market sector & individual freedoms are compressed - - contrary to the intent of the founders of our Constitution.
If 10% of an economy's national income depends on government spending & control, then its economy can be called 10% 'socialistic' and 90% free-market. If government steadily expands its control over time faster than the economy, such that say 45% of the economy becomes socialistic (dependent on government spending), then only 55% of the economy is free. That's where we are today.
If such expansion is gradual over time, many do not recognize what is occurring. They may sense a steady degradation in quality of life and self-control of one's destiny, feel like they are running faster to keep even with more difficulty becoming debt-free themselves, but do not understand the cause.
Like a cancer, government steadily & stealthily spreads - step by step eroding citizen freedom and economics. At some point, if not reversed, the future well-being of citizens can become even more severely jeopardized - - as proven by history.
Over time more and more citizens have become so dependent on government spending (control) that, while they know major changes need to be made, they resist the very changes that are needed to restore the health of their freedom and economic future, and that of their children and grandchildren.
They have become so government-dependent (or, addicted) that they fear giving up that dependence. They have been 'captured' by socialism - - and, headed toward a result their founding forefathers never intended - - a road of increasing serfdom to the state.
America is more a socialistic nation, and less a free-market economy, then ever before in its history, because our total economy has become significantly more government-dominated and dependent.
Think of the total economy as a pie, divided into two economic slices (the government sector share and the pure private sector share), where the whole pie is the total national income. If the government share expands faster than the total economy, then the free-market private sector's share is compressed.
With 3 simple color pictures, we will view the relationship between these sectors at three different times in our history (prior 1930 and the New Deal, after World War II disarmament in 1947, and as it is today) - - and observe the march of socialization in America.
Keep your eye on the red slice of the economic pie, as we will move from the first pie chart (below) to the second, and then to the third. That's the government [federal + state & local] spending sector dominating & controlling more and more of the nation's economic pie.
Therefore, less and less of the nation's economic pie is left for the pure private sector, being that part of our economy not dependent on government spending yet upon which national productivity, savings, living standards AND freedom fully depend for our youth.
HERE COME THE PICTURES
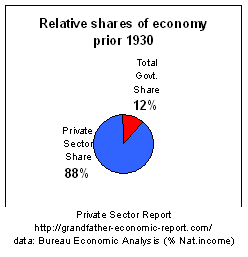
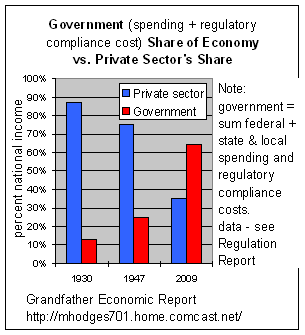
Picture #1: Look at the left chart.
7 decades ago, when many of today's senior citizens were children, just 12% of the economic pie was dependent upon GOVERNMENT (the red slice of the pie).
Restated, 12% of national income was consumed by government spending back then.
This left 88% of the pie to the productive PRIVATE sector (blue pie slice).
At that time the private sector was 7.3 times larger than the government share.
America WAS 88% FREE and 12% socialistic.
Note: to cover the 12% government spending share of the economy (red slice) with enough tax revenue, the average person had to work 1.4 months per year. (Today's government spending, as you will soon see, requires that person to work 5.3 months to support government.)
*(the technician will note national income used to measure the economy, not GDP. This approach was firmly recommended by Nobel Laureate Milton Friedman, as the only proper method - - discussion at bottom of page)*
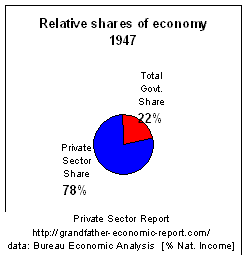 PICTURE #2 - post World War II
NOW, watch the non-productive government share in the left chart double to 22% of the economy, from the prior 12% share. (the red slice got bigger),
and note the remaining portion left to the productive private sector has been squeezed out of 10 points, compared to the previous chart.
That 10 point swing was mostly attributed to government getting into the 'socialized spending business', starting with the 'New Deal'
- - basically going into the social business, an area never envisioned by our founding forefathers as a reason for forming a federal government..
At this point, the private sector was about 4 times larger than government - - well below its prior 7 times larger ratio of the first chart.
America was 78% FREE and 22% socialistic. (instead of 88% free and 12% socialistic in the first chart).
From chart #1 to chart #2, we have observed how the private sector's share of the economic pie was reduced by 10 points - as a result of socialization up to 1947.
Was that 10 point shrinkage of the private sector by government expansion enough?
Look at the next chart to see what has since occurred.
It's not pleasant.
PICTURE #3 - TODAY
NOW, look at the left chart for today.
the government sector (red color) doubled its share again -
from 22% of the economic pie in 1947 to 45% of the economy today,
shrinking the private sector share (blue color) of the economy an extra 29 points - - caused by even more expanded socialistic spending (not intended by our nation's founders), at rates many times faster than growth of the general economy.
Now the productive private sector (having lost an additional 29 points) is not much bigger than the government-controlled share of the economy;
a long fall from its prior position of being from 5 to 7.3 times larger than government.
American has become 45% socialistic, leaving only 55% FREE, a tremendous move from the first chart of 12% socialistic and 88% free.
Notice to Reader
Below you will find links to backup reports;
it is suggested you first read the full page without clicking a link,
then if you wish, go back to the link of your choice
From chart #1 to chart #3, government expanded its share nearly 4 times faster than the total economy.
This requires the average citizen today to work 4 times longer each year just for federal and state/local taxes to cover this expansion - - from 1.4 months of work to cover government in the first chart to 5.3 months of work to cover government spending today.
There's no free lunch. If you want big government then you work for it.
Why do you think today's citizens allow more government
than did their grandparents or the nation's founding forefathers?
NOTE: had the National Healthcare Plan of 1993 been implemented, the Government red slice for the last chart above would have jumped at another 10 points (to about 50% of the economy),
reducing the above Private Sector blue slice to half - - effectively causing the 3rd major social spending surge in U.S. history. Perhaps those interested in another social spending surge will continue to try again.
Scroll up and check those 3 charts again - and watch the growth of the red slice of the pie.
NICE MOVE, RIGHT ?????
QUESTION: Who was it that said: "Government that governs least governs best"?
ANSWER: Thomas Jefferson. (the above charts show America's massive departure from the wisdom of his warning).
QUESTION: Who was it that said family income, saving, living standard AND freedom growth depend on the capacity of the private sector?
ANSWER: Just about every economist in the world, including the Economic Report of the President to Congress.
NEXT QUESTION: If most say nearly all eggs belong in the private sector basket for the sake of good and secure jobs with long term real income growth, then why have we allowed government to grow faster than the economy - - and thereby shrink the relative size of that important private sector and its capacity to generate good stuff?
ANSWER: There can be but one answer. Those in control in recent decades have been more interested in government expansion, political power, control and dominance, than in families and children and their freedom to choose - and more convinced that big government knows better than families what is good for them, or for children than their parents. What else explains the result?
QUESTION: Who said government has too much power?
ANSWER: 63% of those answering the 1997 poll conducted by Opinion dynamics and Fox News. (pg. 21, The American Enterprise, Nov/Dec 1997).
QUESTION: Who said the federal government creates more problems than it solves?
ANSWER: 72% of those polled March 1995, conducted by Hart/Teeter Research for the Council of Excellence in Government.
LAST QUESTION: Who was it that said today's average citizen should spend 5 months per year just to earn all income, sales, excise and property taxes (plus debt loads), compared to but 1.4 months working in government servitude in prior generations? It stands to reason, the more you work to pay government the less of your work effort is left over for your own use today and for your future.
ANSWER: I don't know the answer, but the facts are that the average citizen today does spend 5 months per year at his job to pay his 'fair' share of all taxes to meet this government growth. Pro-big government advocates obviously believe bureaucrats are better at deciding what to do with ones earnings than families and workers making their own decisions.
And, WHAT HAPPENED?
While there are so many wonderful things about our great nation, as summarized in the Celebration Report, there are also some troubling items that need attention. If we understand the negatives then we have the chance to make the nation we hand over to our children and grandchildren even better.
For the first 1 ½ centuries following our Constitution, American government stuck
to the 4 principle reasons for government.
As documented in the Federalist Papers of 1787, Alexander Hamilton, etc., the framers of
our Constitution outlined but four (4) principal reasons for government to assure our
welfare: (1) national defense, (2) preservation of peace between states (civil wars,
riots), (3) trade between states & nations, and (4) international relations.
If successful in carrying out those principles, it was believed the 'welfare' of citizens
would be assured. (note- this was their meaning of the word 'welfare', not income
distribution and entitlements).
As further evidence of original intent, for the following 1 ½ centuries the federal
government stuck by those principal reasons, and by the late 1920s was still
consuming/controlling only about 3% of national income (the economic pie), as shown by
chart bottom of page.
Taxation was used only to pay those bills. Such principles did not include such items as
social welfare, entitlements and income re-distribution functions.
We were a nation that used government primarily only for those 4 principles, relying on
ourselves for all other needs. This history is covered in A Road
to Serfdom & Legacy.
Starting with the New Deal in the early 1930s,
America embarked on a course of expanded socialization programs, an area not included by
her founders in their 4 principal tasks of government. We imported from Europe the concept
of Big Government and socialization of the economy. (note: its amazing that
we would listen to 'ideas from Europe' since much of our nation was formed by those
fleeing European history and its reliance on big-government and centralized power).
The next leg up started after WW II, and gained a tremendous acceleration with the Great
Society of the 1960s. America had started along an un-charted path, of increased citizen
servitude and government-dependence - - and, the 'chickens are coming home to roost.'
Despite these two (1930s and 1960s) surges in government expansion, there was a major
attempt in 1993 for a third surge, being the National Healthcare Plan - - which sputtered,
but may not be considered fully aborted - - despite clear evidence of the world-wide
failure of dominant government and socialization, and the resulting reduction of citizen
freedoms and economic opportunity therefrom.
Since the 1920s, the federal government share of the economy has zoomed from a 3% share to
a 24% share (8 fold increase) (see Federal Government Spending
Report). And, just 16% of the federal budget goes to national security - - the prime
reason our founding forefathers formed a federal government. That leaves 84% of federal
spending to other areas, which dilutes focus from the prime mission: national security.
And, state & local government's spending share of the economy increased 2-3 times (see
State & Local Government Spending Report) - - as the
number of people employed by state & local governments continues to expand faster than
growth of the nation's population.
Nearly all of the increase is in the 'social arena', an area not included by our founders in their 4 principles for creating government.
A few resulting items:
2 ½ decades of stagnant inflation-adjusted median family incomes with declining savings
to historic lows (see Grandfather Family Income Report) - and
soaring household debt to historic highs (see America's Total Debt
Report, 67% of all federal debt in history was created in the 1990s (see Grandfather Debt Report) yet our founding forefathers intended debt
only during war-time provided paid-off thereafter, record poor international
competitiveness (see the International Trade Report), poor
national productivity and savings (see the Productivity Report),
terrible education productivity especially compared to foreign competitors (see the Grandfather Education Report), run-away social spending (see Social Report), etc., etc. (for a listing of all reports, visit the
Home Page).
And, these only describe some of the economic ramifications - - not the biggie: freedom of choice - - and the attendant ramifications eroding our beloved society such as family values, reduced education quality, drug use of our youth, increasing majorities of children without full-time moms, etc.
Additionally, the Tax Report shows the average citizen must work 5 months per year just for taxes to pay for this spending, compared to but 1.4 months required in prior generations. Did our nation's founding fathers intend this?
As stated above - - 84% of the federal budget is consumed by agendas having nothing to do with national security, which was the prime reason for forming a federal government. And, in recent years, national security spending as a share of the economy has dropped to the lowest level in several generations - - leaving our nation vulnerable to surprise. See the National Security Report.
And, WHY DID IT HAPPEN?
We see the dramatic pie chart trends above.
The Government Spending Report shows the year to year trends, with increases faster than the economy for social spending per the Federal Spending Report plus the dramatic increases in the State & Local Government Report, plus rising Federal Government Debt and Regulations.
These trends happened because pro-government forces sold the 'free-lunch' concept to voters, and we fell for it and turned over more control of their lives to government.
But, the Voter Report shows a declining rate of citizen participation in national elections, indicating that a lower and lower percentage of voting-age citizens believe there is something they as citizens can do to turn this around.
And, the Trust Report shows trust in government declining to near an all-time low.
A sad commentary on a representative democracy. What about the next generation?
OK. That's Enough. Now, about those three pie charts above?? Take a look below.
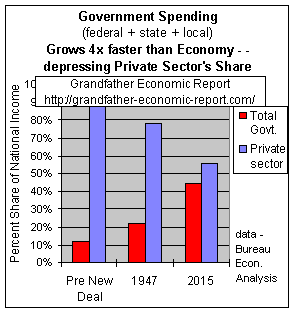 COMBINATION CHART
This chart combines, in bar form, all 3 Chart periods we saw above.
The red bars in this chart show the upward march of combined government spending growing 4 times faster than the economy - -
from a 12% share to the 45% share today.
The blue bars in the chart show the reciprocal downward slide of the private sector's share of the economy, as it lost 39 points to government spending growth - -
from an 88% share down to a 55% share today.
In addition to that, perhaps you would like to see a 131-year trend chart of U.S. government spending ratios in comparison with the spending record of other nations - - and, a comprehensive study proving large government equates to lower economic growth.
OUR OPENING QUESTION:
HOW BIG SHOULD GOVERNMENT BE??
- - recognizing our history and that our founding forefathers called for limited government - -
Was 12% of the economy enough - - or should government control more than today's 49% of the economy?
The correct answer should not exceed 20%. Most Americans believe that is sufficient - - and this ratio is supported by history and a major congressional study on growth. However, even that ratio would probably be considered excessive by our nation's founders and our history prior to World War II. Therefore, government spending control of the economy today is at least twice what it should be.
REGULATIONS FURTHER INCREASE THE IMPACT OF GOVERNMENT
- by another 14 points -
 The above charts all show government spending as a share of the
economy over time - with government's share today at about 45% of national income. But, government
spending is not the only activity by government which reduces the private sector's share
of the economy. Not only must we cover government spending, but we must also pay for
the costs to comply with government regulations - - since government officials create
and mandate regulations on the private sector which further reduces the private sector
because government does not 'fund' these costs - nor does it budget them. The cost to
comply with said regulations (about 14% of national income) is just as much an economic
impact caused by government as is government spending (59%).
The above charts all show government spending as a share of the
economy over time - with government's share today at about 45% of national income. But, government
spending is not the only activity by government which reduces the private sector's share
of the economy. Not only must we cover government spending, but we must also pay for
the costs to comply with government regulations - - since government officials create
and mandate regulations on the private sector which further reduces the private sector
because government does not 'fund' these costs - nor does it budget them. The cost to
comply with said regulations (about 14% of national income) is just as much an economic
impact caused by government as is government spending (59%).
The rising red bars in the left chart represent the sum of government spending plus regulation compliance costs mandated by federal, state and local government. You will note the latest year shows the government spending-regulation combination at about 64% of national income (49% spending plus 14.9% regulatory compliance costs).
The current ratio of 64% equates to 7.6 months per year of a worker's income needed to cover government (federal, state, local) spending & regulations - - (6.1 months to cover government spending and another 1.5 months to cover mandated regulatory compliance costs).
The declining blue bars in the left chart represent the residual share of the economy remaining to the private sector after subtracting combined government spending and regulatory compliance costs - - as the private sector's share dwindled from about 88% of the economy in the past to only a 3935% share today.
The Grandfather Regulation Cost Impact Report (at: https://grandfather-economic-report.com/regulation.htm) shows mandated regulatory compliance costs are about 14.9% of national income (11.2% federal regulations, 3.7% state & local government regulations). Dramatic pictures in that report, with reference to one of the few learned studies.
Suggestion: click this to flip through those charts one more time
Government Dependency Growth
A Heritage Foundation study shows >
Government dependency (people
depending on government)
increased 3 times faster
than the general population since 1962,
and 2x the growth rate of the population above age 65.
Americans have always expressed concern about becoming dependent on government. This is partly because they worry that such dependency will erode the spirit of independence and self-improvement. This concern explains why there was such broad support in the 1990s for welfare reform designed to reduce dependency.
However, this concern is also partly explained by the fear that, as citizens become more dependent on government, the very nature of our democracy begins to change. A citizenry that reaches a certain tipping point in dependency on government runs the risk of evolving into a society that demands an ever-expanding government that caters to group self-interests rather than pursuing the public good.
Today, are we more or less dependent on the government’s income and social support programs— especially federal programs—than we were 40 years ago
The Danger of Dependency: A Historical Perspective
Independence was the theme of the American Revolution. The colonists sought independence not only from Great Britain, but also from military occupation, royal overseers, arbitrary laws, taxation without representation, and—as it says in the Declaration of Independence—all that “evinces a design to reduce them under absolute Despotism.”
A better way to understand independence is to recall the classical goal of self-sufficiency. Not exclusively or even primarily material, self-sufficiency encompasses more a sense of moral purpose and well-being. For America, this meant freely choosing their own leaders, establishing their own laws, and setting up a government to ensure their own safety and happiness, or as the Declaration of Independence says, “to assume among the powers of the earth, the separate and equal station to which the Laws of Nature and Nature’s God entitle them” and obtain the full power to do the “Acts and Things which Independent States may of right do.
The opposite of independence is dependence, which the American Founders deplored following Blackstone’s definition: “Dependence is very little else but an obligation to conform to the will or law of that superior person or state upon which the inferior depends.”Thomas Jefferson was more to the point: “Dependence begets subservience and venality, suffocates the germ of virtue, and prepares fit tools for the designs of ambition.[Thomas Jefferson, Notes on the State of Virginia, Query XIX (1787).]
In Democracy in America, Tocqueville warned that the American future is “an innumerable multitude of men, all equal and alike, incessantly endeavoring to procure the petty and paltry pleasures with which they glut their lives.” Government becomes the parent, he writes, as “it provides for their security, foresees and supplies their necessities, facilitates their pleasures, manages their principal concerns, directs their industry, regulates the descent of property, and subdivides their inheritances: what remains, but to spare them all the care of thinking and all the trouble of living?” [Alexis de Tocqueville, Democracy in America, Vol. 2, Part 4, Chap. 6 (1840).]
“Such a power,” Tocqueville concludes, “does not destroy, but it prevents existence; it does not tyrannize, but it compresses, enervates, extinguishes, and stupefies a people, till each nation is reduced to nothing better than a flock of timid and industrious animals, of which the government is the shepherd.”
The American Founders opposed dependency, feared the dominance of a majority faction, and saw the solution in constitutional self-government. They never imagined that a majority faction could be animated by a dependence on big government. For his part, Tocqueville vividly describes what might happen when subservience is combined with the modern administrative state and warns of the dangers of the despotism of dependency.
William Beach, Heritage Foundation, 6/2005 (See this study as link # 26 on my Link Index)
5 extra questions > |
QUESTION # 1Nearly everyone agrees future living standards and savings, low national and household debt ratios and free choice depends upon the private sector. What can we expect for the long-term future for our children & grandchildren with such a dominant government sector? It seems to make sense it would be best for their future if the relative size of the private sector were increased by significantly downsizing government's share, for a change - toward a size envisioned by Thomas Jefferson. Why not? |
QUESTION # 2Is it fair to bequeath to today's infants an economy so much more dependent upon government spending and with a smaller relative private sector share than we inherited ? |
QUESTION # 3Have you heard anything from our leaders of plans to reduce the spending of the federal government and state & local government sectors in relation to national income to much lower ratios (at least closer to post world war II ratios), and thereby expand the productive private sector's share of the economy? [Nothing is said about reducing government spending AND amortizing to zero the total debt principal being left (incl. trust fund IOUs) to our grandchildren.] |
QUESTION # 4Have you witnessed any real solution by the Congress and the federal government to address the exploding time bomb of Social Security and Medicare, or to cease siphoning-off all surplus in the Social Security and federal employee trust funds - - as fast as it arrives - - and spending same on non-pension items - - thereby perpetuating total debt and insecurity for future retirees? |
QUESTION # 5Have you heard of plans to reduce the un-funded regulatory compliance cost burden ratios by a measurable amount? [This is a dangerous area. As government comes more and more under spending restraints the political temptation accelerates to pass more & more un-funded mandated regulations which further weaken the reduced private sector. Can you imagine that government can impose regulatory cost burdens amounting to 13% of the entire economy without even at least budgeting such?] |
Perhaps some hope we have not noticed, and are glad that grandchildren cannot vote. |
What national policy actions are suggested by these charts to enhance the economic future and security of our children & grandchildren, and how can such actions be encouraged? It is my view that the share of our economy now controlled by government should be downsized to a level that does not exceed the historic norms that occurred before and right after World War II. This report is a section in the series of Grandfather Economic Reports , which are aimed to provide information about economic threats facing families and their children, compared to prior generations - with recommendations.
HERE'S A CHALLENGE FOR YOU
This author has developed a set of graphics showing a format approach for setting possible targets for government spending and private sector ratios in the ACTION PLAN TARGET REPORT, in case you would like to view same. Perhaps you will use this model to develop your own set of targets - - and share with the author by email.
This grandfather hopes the presentation is useful and informative by displaying real data by a method that is easy to understand.
There is no attempt to point fingers, or play politics. This is about our children and grandchildren and what type of economy we want to leave to them. More government or less? Contacting your congressional representative and informing your friends and family members might help if you are as concerned as we.
DO YOU HAVE TIME TO BECOME EVEN MORE INFORMED? The first chapter below shows trends of the 2 government sectors with
pictures; |
|
or - -RETURN TO THE GRANDFATHER ECONOMIC REPORT - Home Page- a series of mini-reports documenting challenges to the economic future of families and their children, compared to prior generations - the home page contains an index of subjects with graphic presentations reviewing: Family Income, debt, savings; government spending and size, education quality, social security, regulations, taxes, energy, inflation, foreign trade and exchange, voter turnout, trust, celebration, and health care/life expectancy |
Exchange information with Michael Hodges via E-mail |
Constructive input and links welcome |
Data Sources: Bureau of Economic Analysis, Commerce Department, and data appendices of annual 'Economic Reports of the President to Congress'. Additional data and sources, inputs, and encouragement provided by Nobel Laureate Economist Milton Friedman. The comments & charts are the author's.
The next 2 paragraphs are provided for strict data technicians. Others may skip-over this stuff, if they wish - - and return to the home page >
*National Income data (instead of GDP data) is used to measure the net size of the economy, because such was firmly recommended (as the only proper method) to this author via written inputs from Nobel Laureate Economist Milton Friedman - in fact, his own data base of severala decades of national income data starting in the 1920s was maled to this author, Michael Hodges to start ths report series. The measure of National Income is exactly as calculated by the Dept. of Commerce's Bureau of Economic Analysis (see 'Note' below for recently revised definitions by BEA). I understand some of the reasons to prefer use of national income data to define the size of the economy, instead of GDP data, include the fact GDP overstates economy size compared to the National Income measure. For example, GDP includes double counting - such as indirect business taxes & transfer payments. Further, GDP treats the consumption of fixed capital as something earned instead of consumed. Additionally, National Income takes into account net factor income payments to and from the rest of the world. [there is an increasing spread between National Income and GDP plots (from a 3 point difference in the 1950s to 10 points today). Other subtractions, up to BEA's 2003 data include indirect business tax and nontax liability including taxes on production and imports less subsidies and also subtracting out business current transfer payments. Such factors, as well as Dr. Friedman's inputs, were accepted for these reports. (In any case, the objective of this report is to show relative trends over time using clean, arms-length data - - ideally data that is consistently defined by the same method year after year.) National income and spending data used in this report, and any adjustments) are from such sources as the Bureau of Economic Analysis (Commerce Dept.), from the appendix tables within each annual-published 'Economic Report of the President to Congress'. (BEA spending data indicates federal grants to state & local governments is in federal expenditures but does not indicate if same is in state & local spending; should it be in both then the federal portion of the charts above would be reduced about 2% points).
Note - recent change by BEA in definition of National
Income. The Grandfather Economic Report series includes many long-term data graphics, and
the consistency of data definition criteria is vital in providing proper long-term trends.
A major change has occurred recently regarding the way National Income data is calculated
and defined by the Bureau of Economic Analysis (Commerce Debt.), starting with 2003 data.
In the Feb. 2004 Economic Report of the President (to Congress) - ISBN
0-16-051539-4, Appendix table B-26, the Commerce Dept.'s Bureau of Economic Analysis
apparently made major changes in its definition of the measure of National Income.
Starting with the 2004 edition I was able to determine that BEA changed the national
income definition by a significant amount, compared to ALL previous such annual Economic
Reports. Starting with the February 2004 edition, BEA showed that from now on the
only difference between Net National Product and National Income is only a subtraction of
a relatively minor 'statistical discrepancy'. This definition change causes National
income to be nearly $1 trillion larger than the way it was calculated and defined for all
prior editions of the Economic Report of the President. For example > in the February
2003 edition of the annual Economic Report (table B-26), for the year 2001 BEA shows
national income of $8,122 Billion - - calculated the same way as in all prior years.
But the February 2004 edition shows that 2001 national income data point at $8,981.2
Billion (a huge $859 Billion difference compared to the prior year's edition for
the same year). This author determined that the February 2004 edition calculation
method for defining National Income for that edition was much, much different than
done for a zillion prior years. The new method no longer determines National Income by
adjusting three (3) items from Net National Product. No longer are the following
adjustments made to Net National Product in arriving at National Income >
(a)subtracting out indirect business tax and non-tax liability (now about $800
billion per year) and also subtracting out (b) business transfer payments (now about $84
billion per year), nor adding-in (c) Subsidies less current surplus of government
enterprises (about $6 billion). As can be seen the lack of the two subtractions is many
times larger than the loss of a minor addition, meaning the 'new' National Income by BEA
far exceeds the definition method employed by BEA for many, many years before. No
footnotes are shown in the B-26 for either the 2004 or the 2005 editions of the Economic
Report of the President, therefore not make any mention of intent to revise the prior
definition method of calculating National Income which has been used for the prior zillion
years. BEA, using its new method of definition, then re-stated 1959 to 2002 historic data
- - which is no relation to the way it was reported for those 43 years before let alone
addressing national income data prior to 1959 used in the Grandfather Economic Report.
Therefore, this author will continue to use National Income by its prior definition in
order to assure consistent data treatment for the many long-term data graphics in the
Grandfather Economic Report series. Consistency of defining National Income by the prior
method definition for years after 2002, using more current data, can be assured since data
to to adjust National Income back to subtract out (a) and (b), and add in (c) can easily
be done since data for these missing items can be found elsewhere (in table B-27) such
that the criteria for all graphics for national income for all years 2003 and forward are
defined the same as those for all years prior to 2003.
[ NOTE - for decades the Bureau of Economic Analysis published detailed national income
data in the appendix data section of each year's Annual Economic Report to the President -
up until 2012, after which neither the 2014 or 2016 publications contained any such data.
Therefore, to be consistent with history those years national income is calculated at same
percentage of GDP as in decades leading up to that point.
| Home & Contents | Summary | Feedback | What's New | Link Index | Eye-opener |
Bottom of Michael Hodges' page at: https://grandfather-economic-report.com/piechart.htm
The Grandfather Economic Report series is the intellectual property of its author; all rights reserved under Copyright Conventions. Permission to redistribute all or part of this series for non commercial purposes is granted by the author, provided the associated web page address is included and full credit given to the Grandfather Economic Report and the author, Michael Hodges. Notice appreciated via email.