SOCIAL SECURITY REPORT
(Jan. 2012) |
Grandfather Economic Report series
| Home &
Contents | Summary | Feedback
| What's New | Eye-opener
| Must See | Email
SOCIAL SECURITY REPORT
(Jan. 2012) |
- inequitable drain on working families and their children, with little offered in return -
A Short Picture Report that is easy to understand
this is the summary page with 4 pictures - the full picture report is linked at bottom of page -
QUESTIONS: Should we bequeath to our youth an economy where real median family incomes and saving rates are contracting as in the past 20+ years, while social security & Medicare costs per man, woman and child sky-rocketed upward, yet today's youth will not receive anywhere near the same buying power of benefits as today's seniors?
Is it fair that, according to several reports by the Social Security Commissioner, "From now on young workers and workers of future generations will be paying over their working lifetimes employee and employer taxes that add to considerably more than the present value of their anticipated benefits?"
Former Federal Reserve chairman, Alan Greenspan, reported to Congress that the social security system cannot survive, without massive tax increases together with major benefit cuts. Of course every congress person already knew that, but they prefer Greenspan to say it instead of them. Meanwhile they allow every penny of paid in surplus to the trust fund to be siphoned-off to support other spending, as fast as it arrives. And still they say they want to 'save social security.'
Is it fair that today workers have paid $2.2 trillion more in FICA taxes than required to support current seniors (including $182 billion of that last year alone - - $1.9 trillion since 1991) to supposedly build up a surplus for their future - - but that surplus disappears as fast as it arrives. Instead of investing the surplus arms-length in something marketable, such as in registered 30-year Treasury Bonds as sold to the public, all $2.2 trillion has been siphoned-off by government and spent on non-pension things - - with zero marketable assets remaining in the trust fund. And that siphon-off continues in the future - - meaning their children face $4 trillion in additional debt into the future? Unlike private pension funds, the trust fund holds zero marketable assets as a result of past paid-in surpluses by workers, just non-marketable bookkeeping IOUs for which no budget commits their play-back and no cash interest is paid. As an example: in 2002 the trust fund took in $596 billion from workers payroll deductions, and paid out to seniors about $456 billion - - meaning a cash surplus intake of $140 billion - - but every penny of that was siphoned-off and spent on non-pension stuff - - and more meaningless IOUs issued. Adding the $60 billion interest the general government should have paid this year in cash on $1.6 trillion IOUs issued in prior years - - the SS trust fund should have added $200 billion in hard assets for future retirees - - but it did not, since every penny was spent on other stuff and more meaningless IOUs created to paper it over. If this happened to a private company's pension account the officers would go to jail.
Is it fair there is still no solution? From the special council to the Secretary of Health & Human Services: "All Council members agree that the pay-as-you-go approach should be changed? But despite its best efforts, the Council was not able to agree on one single plan for dealing with Social Security's financial difficulties."
 Report 2012 >
The Social Security program ran a $47.8 billion deficit in fiscal 2012
as the program brought in $725.429 billion in cash and paid $773.247 for benefits and
overhead expenses, according to official data published by Social Security Administration.
The Social Security Administration also released new data revealing that the number of
workers collecting disability benefits hit a record 8,827,795 in December--up from
8,805,353 in November.
The ratio of workers to beneficiaries peaked in 1999 at 2.927 to 1.
Raiot was 2.361 at end 2012.
Trustee Report 2010 > Social Security will begin paying out more in benefits than it receives in taxes in 2010, 7 years earlier than expected last year. For more than two decades, Social Security collected more money in payroll taxes than it paid out in benefits — billions more each year. Not anymore. This year, for the first time since the 1980s, when Congress last overhauled Social Security, the retirement program is projected to pay out more in benefits than it collects in taxes — nearly $29 billion more. Sounds like a good time to start tapping the so-called Trust Fund surpluses. Too bad the federal government already siphoned-off and spent that surplus over the years on other programs. In return, the Treasury Department issued a stack of IOUs, with no plan in any budget to pay them off. Trustees reported Medicare began paying out more in benefits than it received in taxes in 2004.
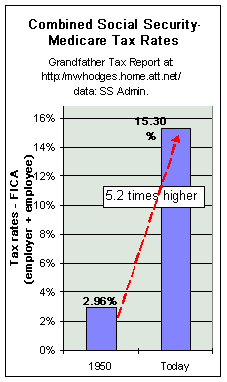
Is it fair that young families pay 5.2 times higher inflation-adjusted social security/Medicare tax rates than seniors did in their working years, while accepting that today's seniors consume twice as much as a typical 30 year old does compared to 35 years ago - plus receive much higher real benefits than today's young will receive when they retire?
Here's a sample of the charts in the main report, this chart showing today's social security/medicare tax rate of 15.3% per worker compared to a 2.96% tax payroll tax rate 55 years ago. Yep - tax rates UP a huge 5 times, 417% higher.
Is it fair that young workers must protect senior pensions from inflation by granting them guaranteed cost of living adjustments, when many working people have zero inflation-protection guarantees for their own earnings?
Is it fair that young workers must pay Medicare and income taxes to help cover increased health insurance costs of seniors, while many working people must also pay increased premiums for their own medical insurance coverage including higher co-payments?
Is it fair that today's working families, where both mother and father must work, have a 1,000% higher load to cover senior pensions than in 1950 when only 1 wage earner per family was required to make ends meet?
And - is it fair that much of the increased worker payroll tax rates shown in this chart were to produce not just enough to cover senior pensions, but to also put a cash surplus into the trust fund to help protect younger workers - - yet every penny of that cash paid-in surplus, $1.5 Trillion extra to date, was siphoned-off and spent on other stuff as fast as it arrived (see chart and discussion below).
A chart in the main report shows how 5-times higher tax rates combine with a 4-times higher maximum on taxable income to produce a 1,700% increase in inflation-adjusted taxes paid.
 The above inequities are as of today. Since the senior
population is growing 5 times faster than the young population, these inequities are but
the tip of the iceberg of that yet to come. The above inequities are as of today. Since the senior
population is growing 5 times faster than the young population, these inequities are but
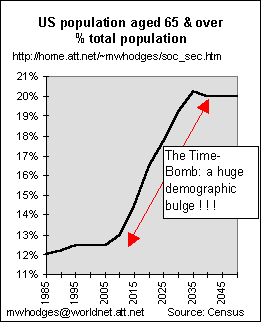
the tip of the iceberg of that yet to come. Were you born after 1945? If so, this chart is for you. Approaching Time-Bomb Note the rising trend line starting 2005. That steep slope means a higher and higher percentage of the total national population will be age 65 or older (those 'baby boomers') - - meaning the pressure on workers during any part of that period may have even higher increased demands on their living standards to fund the explosion of the senior population - - and there are not enough workers to even do it without pushing many to poverty. And, the surplus paid into the 'trust fund' by working people with their FICA to help cover that time bomb is not there, as it was 100% spent on non-pension programs - a shell game, a scam. Find your own retirement period on the chart. The higher up the curve, the greater the threat to meaningful benefits. And, if you are a working person during that rise, watch out. There can be little doubt from this chart that social security & Medicare as we know it is nearing DEATH. To hit home, hard: The President's Economic Report to Congress of 2/03 shows in 1999 there were 1 million fewer citizens under age 5 than 40 years ago (1959), yet there were 19 million more citizens aged 65 and over in 1999 than 1959. What a burden those children now under 5 face for the next 60 years - - unless we completely reconstruct government's role regarding social security and medical care. |
HOW CAN THEY SAY THEY WANT TO SAVE SOCIAL SECURITY WHEN THEY ARE RAIDING IT? |
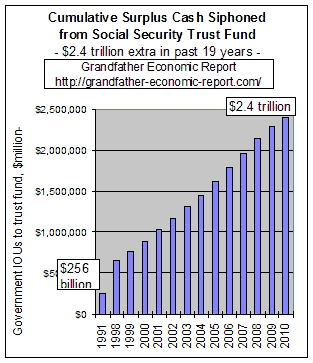
 At the left is a chart from the Trust Fund and Deficit Report (and its in-depth companion) showing the growing amount the
general federal government owes the Social Security trust fund from 1991 to date - the
increase being that additional amount (above needed to cover retirees) of new paid-in
surpluses (that came in from such payroll deductions as FICA) that was siphoned-off
by the general government and spent on non-pension things. Every penny is gone, never to
be available for its intended purpose - - senior social security pensions. Workers
and their employers were hood-winked, for sure!! At the left is a chart from the Trust Fund and Deficit Report (and its in-depth companion) showing the growing amount the
general federal government owes the Social Security trust fund from 1991 to date - the
increase being that additional amount (above needed to cover retirees) of new paid-in
surpluses (that came in from such payroll deductions as FICA) that was siphoned-off
by the general government and spent on non-pension things. Every penny is gone, never to
be available for its intended purpose - - senior social security pensions. Workers
and their employers were hood-winked, for sure!!As of the end of fiscal year 2008, $2,150 billion ($2.2 Trillion) of in-coming surpluses from workers had been siphoned-off to-date from the Social Security trust fund - a 760% increase of $2 trillion since year-end 1991 - every penny spent on non-pension stuff. ($182 billion of that was extracted last year alone). Non-marketable IOUs were put in the trust in exchange for the cash taken out - - with zero plan budgeted by either political party to redeem those IOUs and repay the trust fund in cash or marketable assets in exchange for the prior cash surpluses removed for other purposes. Same goes for interest due, it's paid with more IOUs instead of cash. A budget should amortize-out (redeem) those IOUs with marketable assets like cash, or workers should have their FICA pay-roll deductions reduced so they are no longer required to send in over and beyond that needed to cover existing retirees - - since any extra is squandered on non pension stuff. Let workers save that extra for themselves. Do You Want Proof that the above $1.8 Trillion in Social Security Trust Fund so-called assets are actually no real assets at all, but just a bunch of empty IOUs - - just pieces of paper - - and government spent all the surplus on other stuff?? Here's some proof > In 2001, a top official, honest enough in public, confirmed the accuracy of this report you are reading, which has been published for years. 'The Social Security Trust Fund has NO Real Assets', said Treasury Secretary Paul O'Neill on June 10, 2001. And, 4 years later, on 21 March 2005, President George Bush said > "the trust fund is just an empty IOU, just a piece of paper. You pay your payroll tax; we pay for the people who have retired, and if there's any money left over, we spend it on government. That's how it works." These statements prove that the $2 Trillion so-called social security trust fund surplus is covered by nothing but worthless, non-marketable IOU pieces of paper. Enron was baby stuff compared to this. Go To Jail > If managers of a private company siphoned-off marketable assets from its pension fund and spent it on other company stuff, they would go to jail - - a law in every state. Why are members of Congress not held to the same standard? |
$44 Trillion shortfall > In a Fortune article titled
“The $44 Trillion Abyss”, Boston University Professor Larry Kotlikoff refers to
America’s massive underfunded entitlement liabilities as ”the
great Treasury cover-up.” According to the professor, the government
doesn't’t really know what it owes, which makes the situation even more frightening.
What’s more our politicians refuse to level with voters and tell them the truth. How
do you level with a voter and tell him all of the surpluses have been spent as politicians
from both parties have persistently raided the trust fund and spent all surpluses?
But, that $44 trillion figure was as calculated a few years ago.
UPDATE > As of Jan 2008 the present value
of un-funded Social Security and Medicare spending has risen to $99.2 Trillion
(see debt summary report).
 And, how about MEDICARE - - soaring into the future, faster
and faster -
In the 1990s, social security spending increased at 6% per year (double inflation), while Medicare continued at over 11% growth per year (3-4 times faster than inflation). According to the 2005 Trustee Report, Medicare went into deficit spending in 2004.
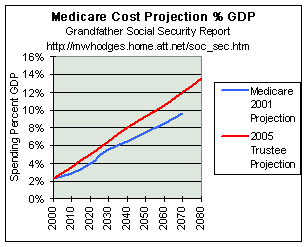
The left chart shows two Trustee projections for Medicare spending (as a share of the economy's GDP) into the future using benefit criteria current law. Note how the red plot from the 2005 Trustee's report projects a more dangerous trend than the report issued just a few years ago shown as the 2001 projection (blue line). (Wonder what the next projection will show)
The chart shows the red line starts at 2.3% of GDP. As it moves to the right the upward slope shows such spending eating up larger and larger shares of the entire economy.
The 2005 Trustee's report projects 12% of GDP by 2070 (higher than the 10% of this chart) and a 13.6% ratio 10 years later.
In the author's opinion, no way can this nation afford to transfer another 12% of its economy to government medical programs - - and, this medical-type explosion is just for Medicare and does not count the soaring Medicaid program.
2009 UPDATE TRUST FUND SOLVENCY
With unemployment rising, the payroll tax revenue that finances Social
Security benefits for nearly 51 million retirees and other recipients is falling,
according to a report from the Congressional Budget Office. As a result, the trust fund's annual surplus is forecast to all but vanish next year -- nearly a
decade ahead of schedule -- and deprive the government of billions of
dollars it had been counting on to help balance the nation's books.
The Treasury Department has for decades borrowed money from the Social Security trust fund
to finance government operations. If it is no longer able to do so, it could be forced to
borrow an additional $700 billion over the next decade from China, Japan and other
investors. And at some point, perhaps as early as 2017, according to the CBO, the Treasury
would have to start repaying the billions it has borrowed from the trust fund over the
past 25 years, driving the nation further into debt or forcing Congress to raise taxes. (Washington
Post 3/31/09)
DISTURBING 2005 UP-DATE - - poor health of baby boomers
According to the Health Care Report - - in December 2005 the National Center for Health Statistics reported >' the march of medical progress in the USA has taken a worrisome turn: Half of Americans in the 55-to-64 age group _ including the oldest of the baby boomers _ have high blood pressure, and two in five are obese. That means they are in worse shape in some respects than Americans born a decade earlier were when they were that age.'
'The health of this large group of the near-elderly is of major concern to American taxpayers, because they are now becoming eligible for Medicare and Social Security. "What happens to this group is very important because it's going to affect every other group," said Amy Bernstein of the National Center for Health Statistics." <
This is additional data roundly sounding the alarm that future Medicare spending may be even worse than expected.
Seniors Squeezed by Soaring Medicare Premiums
While some rightly worry that Social Security may not be there for future retirees, already today's seniors are being squeezed as Medicare premium deductions soar at a rate much faster than gross Social Security income.
Consider this > At the end of 2003 the government informed seniors that because of a rise in the cost of living their 2004 social security benefit income before deductions would be increased by just 2.1% (implying nearly nil inflation). However, in the same notice, government implied there was a huge amount of inflation since seniors were also informed of a 14% increase (7 times the published general inflation rate) in the deduction from their SS payment to cover the Medicare premium. As a result, net SS payments to seniors fell behind inflation. Additionally, at the end of 2004 seniors were notified their 2005 gross would be increased 2.6% (implying moderate inflation) yet the deduction for Medicare would be increased by a huge 17.4% - - (again 7 times the published general inflation rate, implying double-digit inflation). And, at end 2005 seniors were notified their 2006 SS gross would be increased 4%, with Medicare deductions increasing 13.2%.
In the 3 years 2004-07 Social Security increased 9% while Medicare premium deductions soared 40%. As a result, many seniors realized a significant drop in the purchasing power of spendable SS income.
Reported June 2008 > Since 1965, the year Medicare was created, the consumer price index has risen at a 4.5 percent annual rate. But the Medicare premium has inflated at an 8.4 percent rate over the same period. Worse, the gap appears to be growing. Between 2000 and 2008, the monthly Medicare premium grew from $45.40 to $96.40. That's a 9.9 percent annual rate of increase. It has been estimated that many a long-lived couple may need to reduce their retirement spending on nonmedical consumption by 13 percent to 26 percent to avoid sharp declines in purchasing power as they get older. http://www.chron.com/disp/story.mpl/business/5836900.html
At this rate, in time, more and more seniors will find they have less than zero inflation protection on their net social security income since it is canceled by soaring Medicare deductions. Is this system going kaput from all directions?
See the Health Care Report for pictures of U.S. health care spending relative to other nations, whereby already the U.S. consumes 82% more of its economy on health care than others - yet, the U.S. has lower life expectancy and less quality care than many other nations.
WARNING: These trends must be reversed.
Action >
Whether you are positive or negative regarding the President's proposed changes to social security he should be given credit for raising this 'third-rail' issue to a high level of public discourse. As one listens to the debate it seems there are only two sides: either for his proposal or against it. But not a peep from any side about fixing the trust fund.
In my view > The first thing that must be done regarding social security is to fully fund the trust fund with $2 Trillion of free-market registered and marketable assets, and tear up existing worthless, non-marketable IOUs on trust fund books. This funding can either be in the form of $2.2 Trillion in newly registered Treasury Bonds exactly like those that are sold to the public (with the trust fund having full right to sell any part at any time on the open market at its discretion), or free and clear title to the equivalent amount of government-owned real estate transferred to the trust fund (the trust fund having the right to sell on the open market) with government paying to the trust fund a marketable net rent in cash on a monthly basis. This would immediately provide the trust fund with full recovery of the $2.2 Trillion in past surpluses that were siphoned-off by the general government and spent on other stuff - plus future income. After this is done, and only then, actions should be taken to bring the revised actuarial calculation into balance by future social security spending cuts. Following this, the issue of the huge deficits of Medicare must be addressed to freeze spending such that the spending ratio does not exceed, for example, at today's 2.9% of GDP.
The Federalist Papers of 1787 documented four principles given by our nation's founding fathers as their reasons for forming a federal government and the Constitution - - national defense was number 1, and social entitlements were not mentioned. Yet today, social programs consume 58% of federal spending. (The sum of social security and Medicare spending, with no limit in sight, is twice as much as defense spending while defense spending ratios are near a 50-year low) - and, its the social 'entitlement' programs that are in trouble. Our founders left out social entitlements from their principles - with good reason.
The inter-generational inequities involved are huge. Does this make us proud?
DATA CHARTS TELL A LOT You have now read the summary page |
To See More Tell-all DATA PICTURES |
Or - return to the home page for other serious issues facing our young
| Home & Contents | Summary | Feedback | What's New | Link Index | Eye-opener | Must See |
Copyright © 1997-2009 Michael W. Hodges. The Grandfather Economic Report series is the intellectual property of its author; all rights reserved under Copyright Conventions. Permission to redistribute all or part of this series for non commercial purposes is granted by the author, provided the associated web page address is included and full credit given to the Grandfather Economic Report and the author, Michael Hodges. Notice appreciated via email.