 This is the summary page of the
chapter on international trade and debt, with 5 graphics. The main trade
report with 16 picture graphics is linked at the bottom of this page.
This is the summary page of the
chapter on international trade and debt, with 5 graphics. The main trade
report with 16 picture graphics is linked at the bottom of this page. Grandfather Economic Report series
| Home &
Contents | Summary | Feedback
| What's New | Link Index
| Eye-opener | Must See
|
Foreign Trade & International
Debt Report |
This is a mini-report about America's increasing dependence on international trade, its poor performance and reliance on savings from other nations instead of its own, causing accelerating debt and asset transfer in favor of foreign interests. Presented in an easy-to-understand format with data pictures, this report is a chapter of the Grandfather Economic Reports series showing various negative challenges facing families and their children, compared to prior generations.
This is the summary page of the
chapter on international trade and debt, with 5 graphics. The main trade
report with 16 picture graphics is linked at the bottom of this page.
QUESTION: Do our children & grandchildren deserve to be placed in a reduced international position with less independence from foreign interests than we inherited from our parents and grandparents? Would that make us proud? Are their future living standards and national security threatened by an economy that is more dependent on domestic and foreign debt, consuming more than we produce and with fewer foreign reserves backing up each citizen than others?
For decades Americans enjoyed the game of consuming more than we produce, borrowing from the future to make-up the shortfall with unprecedented ratios of domestic and foreign debt increasing much faster than national income. These are dramatic facts, with significant long-term implications for the currency, international economic power, relative standard of living, and possible national security of our nation's children into the future.
This lack of savings and over-borrowing from foreign interests cannot continue forever.
The signal to free-up our economy from debt addiction is clear
 INTERNATIONAL TRADE - NEGATIVE TRENDS EXPLODING
!!
INTERNATIONAL TRADE - NEGATIVE TRENDS EXPLODING
!!
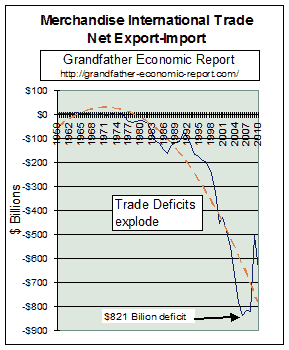
This chart measures the U.S. merchandise (goods, excluding military) trade balance each year since 1959. It shows previously the USA ran a balance of trade, meaning we were able to sell enough goods to other nations to pay for what we purchased from them.
America now runs massive deficits. If a country runs a trade deficit it is borrowing from the rest of the world so that it can spend in excess of its own production. This means the USA is less competitive than before. NOTE: The U.S. is setting record negative trade balances each year. Since 1992, deficits have exploded. Look at that trend !!
This chart shows 2010 trade performance in goods was a $647 billion trade deficit - - 28% over prior year even with an economic recession in progress and a huge decline in the international value of the US dollar. Dangerous trend!!!
How can this record deficit continue in light of a falling exchange rate? The answer is an easy one > America's private and government sectors are increasing debts at a faster rate, much faster than incomes, causing more consumption and imports than could be supported by incomes and negligible savings. In a nut-shell > America is living beyond its means - - way, way beyond!!
The manufacturing base shrinkage is a major negative regarding trade balance, and a major negative impact on U.S. economic independence and future living standards.
In 2010 the U.S. had a total merchandise trade deficit of $647 billion, while Japan & Germany produced a cumulative trade surplus of $286 billion ($83+$203). That's a whopping $1 trillion worse relative trade performance for the U.S., in JUST ONE YEAR. In 2001, for the first time, China surpassed Japan as the country with the largest trade gap with the United States. America's deficit with China surged 95%, reaching $266 billion and 28% of total US trade deficits in 2006.
This vividly shows how America is living beyond its means - - by consuming more goods made by others than it produces to meet the needs of foreigners - - resulting in exploding debts in favor of foreigners, in addition to record high domestic debt ratios of household, business and the domestic financial sectors.
It can be seen that the pattern since the mid 1970's brings into focus the basic question above - - America's lack of competitiveness world-wide - - increasingly so each year. This indicates the U.S. has become less competitive, despite claims of recent improved productivity (mostly realized only by a narrow part of the economy and primarily by revising how they measure productivity and inflation).
 USA CUMULATIVE TRADE DEFICITS
- - past 22 years
USA CUMULATIVE TRADE DEFICITS
- - past 22 years
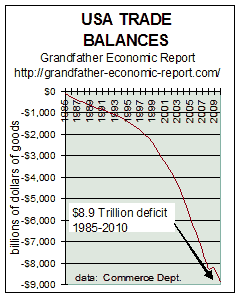
The chart above showed the USA merchandise trade deficit for each year - - reaching an all-time record deficit in 2010 of $647 billion.
The left chart shows the USA cumulative merchandise trade deficit - - with all nations since 1985. (cumulative means adding all deficits)
The cumulative merchandise goods trade deficit was $8.9 Trillion during the last 25 years (since 1985). That means each American man, woman and child effectively borrowed $29,470 from producers in other nations, because we Americans consumed more goods from other nations than we produced and sold abroad. As a result, foreigners now own over $9 trillion more in US assets than in 1985.
Not shown on the chart is the cumulative goods trade deficit since 1976 - - totaling $9.3 trillion. Prior to that period America produced near continuing surpluses with the rest of the world allowing America to own more assets in foreign nations than they in ours. However, that net has eroded over recent years to an accelerating negative net worth.
Taking into account goods and services, and investment flows, which is called the current account - - "foreign-owned assets in the US totaled US$9.4 trillion in 2001 while US claims on the rest of the world amounted to US$7.2 trillion," according to the White House Council of Economic Advisers - - meaning a net $2.2 trillion deficit with other nations as of 2001. Adding to this negative the combined current account deficits of $1.64 trillion for 2002, 2003 and 2004 sums to nearly negative $4 trillion against the U.S. in favor of non-U.S. entities. Not only is the technology product sector in deficit, but the U.S. Department of Agriculture Economic Research Service estimates 2005 will be the first year in nearly 50 that America will not turn an agricultural trade surplus.
How can competitiveness be said to rise as the result of higher so-called
"productivity" if at the same time the trade deficit explodes? What
competitiveness?" It is clear that the so-called 'economic boom' of the 1990s was
a false boom, because the economy was fueled primarily by increasing internal and foreign
debt - - instead of by internal production, savings and competitiveness.
The above chart shows our growing lack of competitiveness as we increase foreign debt
at a faster pace. The long-term performance of our currency is our fault >
negative trade balances fueled by massive domestic and international debts.
 MANUFACTURING BASE DECLINE
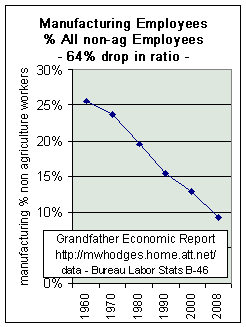
How can America ever export enough goods to other nations to balance its negative balance of trade of soaring imports if it has a declining manufacturing base?
The left chart, from the Family Income Report chapter about stagnant income growth, shows the trend of the number of manufacturing workers as a percentage of all U.S. employees (non-agriculture) - - from 26% in 1960 to 9% in 2008, a 64% drop in the manufacturing ratio.
On a GDP basis the trend is the same negative > the U.S. manufacturing base declined from 30.4% of GDP in 1953 (when we had a trade surplus) to 11.7% in 2007 - also a 62% drop in the manufacturing share of GDP - and more of the remaining manufacturing base is foreign-owned than before. (Bureau Economic Analysis table b-12, Economic Report of President, appendix table)
The number of manufacturing employees declined 4.1 million (24%) from 2000 to 2008.
As America's manufacture of goods has become a much smaller share of the economy and of its work-force, the U.S. became 5 times more dependent on foreign imports - - consuming 17.5% of national income, up from but 3% in 1960s. The export ratio has not improved in 30 years, despite many devaluations of the dollar.
Note the down-sloping trend of this chart far pre-dates the opening of China as
a major world manufacturer.
According to economist Steve Roach of Morgan Stanley (4/05), "the average Chinese manufacturing
worker made 12,496 yuan in 2003, which translates into about US$29 per week. By contrast, average weekly earnings of US manufacturing
workers amounted to $636 per week in 2003. With
Chinese manufacturing wage levels only 4.5% of their
Bottom-line > manufacturing base shrinkage is a major negative regarding America's trade balance, economic independence and future living standards, including national security.
 DEBT-DRIVEN
IMBALANCES
DEBT-DRIVEN
IMBALANCES
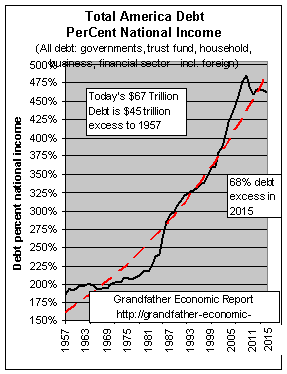
The chart at the top of this page showed America's trade deficits started soaring in the late 1970s to early 1980s. Today's deficits are increasing even faster.
Now look at the left chart, from the powerful chapter 'America's Total Debt Report.' It shows America's total debt (sum of all government debt and all private debt of households, business, and financial sectors) started to grow faster than growth of the economy's national income - - at about the same time (late 1970s to early 1980s) - - increasing even faster today.
What this says is that debt drives over-spending, over-consumption - - beyond incomes and savings. Therefore, excessive debt also drives imports - - faster and faster, driving soaring trade deficits.
This chart is a ratio chart - - a ratio of total debt in America to national income. If America's debt dependence were not growing faster than the economy during this period the chart's trend line would have remained horizontal. However, the debt ratio's trend line is straight up in the past 25 years, which means debt increased each and every year faster than growth of the economy. Much of that debt was promoted by Federal Reserve interest rate and government tax policies - - including more rapid debt growth lately fueled by record low interest rates.
To say soaring trade deficits were greatly influenced by soaring internal debt generation, which drove consumption beyond incomes and personal savings, would be an under-statement, for sure.
What are foreigners doing with that which we borrowed from them? Answer: they own increasing percentage of our businesses, stocks, bonds, real estate and government treasury bonds. Meaning > > Americans own less and less of their nation.
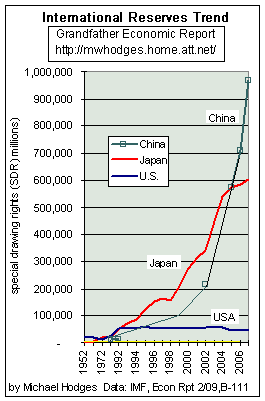 FOREIGN RESERVES - USA STAGNATES - - OTHERS
GROW
FOREIGN RESERVES - USA STAGNATES - - OTHERS
GROW
Another way to look at the U.S. international economic position is to look at trends in foreign reserves compared to other nations - - and then ask the question > is the U.S. growing its reserves at least as fast as others or is it lagging behind - - perhaps lagging way behind because it spends much more than it produces relative to others?
Foreign reserves are equivalent to a nation's liquid international savings account, being assets it can freely spend for foreign goods and properties. (keep in mind that said reserves do not take into account international debts). Bottom-line: the more foreign reserves a nation has, compared to others, the better.
This chart shows foreign reserves each year for the past 54 years. Note how the USA stagnated since 1992, with zero growth - - as Japan's reserves soared AND later China's exploded upward.
Note this chart's data is in International Monetary Fund special drawing right units (SDRs). The chart data points for 2006 are: China 690,069 SDRs, Japan 585,209 SDRs and USA 93% less at a mere 46,071 SDRs. (2006 IMF exchange rate was $1.507 per SDR)
Just look at the international reserve trend of China and Japan, compared to the U.S. (If this chart were adjusted for inflation the U.S. position shown on the chart would be in steep decline).
Restated in dollars, the 2006 SDR data points are equivalent to China $1.04 Trillion, Japan $882 billion and USA just $69 billion.
Together, China and Japan own 40% ($1.9 trillion) of total World international reserves ($5 trillion). The U.S. share is just 1%.
Additionally, the USA has tremendous international debts exceeding $10 trillion to more than cancel out its mere $69 billion in international reserves, whereas Japan has zilch international debt.
Devaluing the U.S. dollar's foreign exchange rate will not solve the problem > The Foreign Exchange Report chapter shows the U.S. dollar's exchange rate mostly declined during the above period of trade deficits and manufacturing base decline. Which, of course, tends to prove that forcing down the dollar's exchange rate is not an assured recipe to produce long-term trade surpluses or a rising manufacturing base.
And, it is wrong to blame China's wage rates and currency exchange for U.S. trade deficits and manufacturing decline, since Japan and Germany each have higher wage rates and a stronger currency exchange rates yet still realize larger trade surplus vs. the U.S. One thing for certain is that citizens of China, Germany and Japan have high rates of personal saving, whereas U.S. savings are nil. They produce and save while Americans consume and increase debt instead of save.
The above charts clearly show America's soaring negative trade balances are certainly impacted by an economy structured more debt-dependent and less manufacturing-dependent and less savings-dependent than ever before. While America can do nothing about Chinese labor rates or Germany's manufacturing expertise its leaders certainly can do a great deal to cease promoting debt-driven consumption subsidized and fueled by tax and low interest rate policy.
DOES IT MATTER - - THESE DEFICITS??
WHAT TO DO?
It has been said that there are only three ways in which negative trade
balances can be restored: (1) the deficit-incurring country (USA) must cease
excessive credit (debt) expansion which sucks in imports faster than incomes warrant and
allow interest rates to climb to reverse debt ratios, (2) other countries must inflate
their economies to over-price their own production so as to suck up more U.S. exports, (3)
the deficit country (USA) must allow its currency to depreciate to drive up prices.
What's happening? Answer (1) USA increases debt even faster (see America's Total Debt Report), while (2) crying for other countries to inflate away their currency and grow their imports from America, and (3) allowing depreciation of the US dollar (see Foreign Exchange Report), causing a loss of international buying power of every US wage earner and holder of dollars - to the tune of negative 40% against the Euro in recent years.
One should not accept leaders hiding-out by calling for a 'level playing field', demanding (as if they have a right to demand) that all non-Americans change their nations to also have huge, soaring debt ratios, near zero savings rates and a declining manufacturing base like America's, with U.S. regulatory compliance cost burden ratios, or even the number of U.S. lawyers per capita. The US must clean its own house and move away from a debt-driven, manipulated low interest rate economy with nil savings and declining manufacturing of goods to one of goods production, rising savings and declining debt ratios. These are covered in the full Trade Report - - link below.
What should happen to those powers-to-be who promote and allow degradation of our currency, our international net worth, and foreign reserves per capita (the international buying power of its citizens) - - and what should happen to those who promote tax and interest rate policies which drive debt and consumption instead of production and savings - - and what should happen to those who make America's future living standards and national security more and more dependent and beholden to non-Americans?????
Is that the proper legacy to pass
along to our children and grandchildren?
This author thinks NOT !!
The trends shown in the above charts (and those in the full report
below) are most dramatic
- - a threat to our economy, and potentially to national security
- -
and - - a threat to our increasing dependence on foreign-produced
energy
- you have now read the summary page of
the Trade Report -
CLICK THIS LINK TO THE Full FOREIGN TRADE REPORT, with 16
color pictures that add to the story (give them a chance to load - as 'a picture is worth
a thousand words')
OR - go to the Economic Report home page for other picture-reports demonstrating impacts to families and youth, compared to the past - - from debt to education quality to family incomes to savings to health care.
Copyright © 1997-2011 Michael W. Hodges. The Grandfather Economic Report series is the intellectual property of its author; all rights reserved under Copyright Conventions. Permission to redistribute all or part of this series for non commercial purposes is granted by the author, provided the associated web page address is included and full credit given to the Grandfather Economic Report and the author, Michael Hodges. Notice appreciated via email.
| Home & Contents | Summary | Feedback | What's New | Link Index | Eye-opener | Must See |