Grandfather Economic Report series
| Home & Contents
| Summary | Feedback | What's New | Eye-opener | Must See |
|
Family Income Report By Michael Hodges - email |
The Grandfather Economic Reports is a series of picture reports of threats to the economic future of families and their children, compared to prior generations - - from incomes to debt to education quality to health care to international trade balances to energy and national security. You are now at the brief chapter on Family Income (starting with this summary page and followed by the full report). Trends in family income, debt and savings are some of those threats facing our young generation. Welcome. We hope your visit will find useful information to help you and your loved ones. Knowledge is Power.
 FAMILIES UNDER
MORE PRESSURE
FAMILIES UNDER
MORE PRESSURE
Because > 4 DECADES OF STAGNANT MEDIAN FAMILY INCOMES (inflation-adjusted) - -
-
- resulting in record high debt ratios and record low rates of savings,
- - with fewer retirement and medical benefits expected,
- - and more children without a full-time mother as more must work to help make
ends meet,
- - with lower quality education and less parental quality time with their
children.
QUESTIONS:
- Are we proud in the past 39 years to 2009 that real family income growth was near zero, whereas in the 23 years before 1970 average incomes increased at an annual rate of 3.6% faster than inflation? No wonder families had to send most mothers into the work-force plus take on huge debts. We will note over the same period huge increases in government sector spending ratios, squeezing down the private sector.
- Are we proud to pass-on to our youth an economy where inflation adjusted median family incomes, living standards, choices and savings are expanding long term, as they were for prior generations - - - or stagnating with less security, as in recent decades? Real household incomes fell in 94% of the states (47 out of 50) in 1999-2005 - - an average drop of 6%.
- Should we be proud that it is more unlikely for a child to have a full-time mother as more mothers leave home to help 'earn the bread' to compensate for family income pressures, compared to prior generations when one wage earner was sufficient and mother was home?
- Should we be proud that families have the lowest rates of saving since 1929 and historic record debt ratios, compared to the past?
- Should we be proud that recent years show a new, all-time record in inflation-adjusted taxes paid by median income dual-earner families to federal, state and local governments, or that families must work more months each year (than before) to pay all taxes?
- Should we be proud that the more your household looked like the traditional one-wage earner family the worse it fared economically since 1970?
 This page is a summary of the Full Family Income Report,
linked below.
This page is a summary of the Full Family Income Report,
linked below.
Many young people and families 'feel' the financial squeeze.
In prior generations before 1970 real incomes and rates of savings were rising smartly. And rates of debt were low. Even with one wage-earner per family. Not now!!
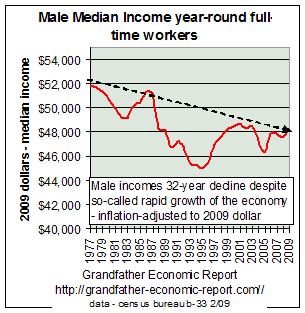
The left picture is a sample of many in the Full Family Income Report (link bottom this page).
It shows > during the 32years 1977-2009 inflation-adjusted median income fell 9.4% for full-time male workers, forcing more mothers to the work-place to try and make up some of the family income loss - - leaving more children without a full-time mom.
NOTE - the chart shows the rapid decline 1977 to 1995, perhaps prompting the federal government to redefine its inflation index measurment criteria to make less inflation appear to occur. Thus, most of the slight up-tick in the latter 1990s was due to this adjustment, thereafter real incomes again falling even using the more lenient cpi measurment. Therefore, the trend line would be shown even more negative to incomes had the the government used the same inflation criteria from 1977 to 2009. (see the Inflation Report and the Statistical Wizardry Report).
For a most dramatic chart showing trend of real family incomes since 1947 see the Full Family Income Report link at the bottom if this page.
Median Household Incomes Fell in 94% of the States - 1999-2005.
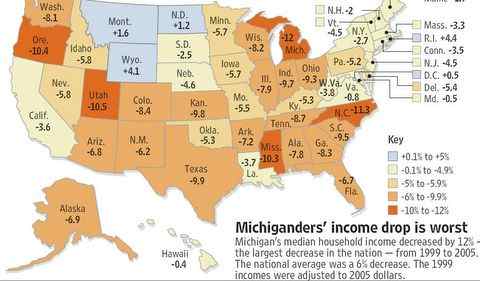 Left is a 2006 chart, showing the percentage decline in
median household incomes from 1999-2005.
Left is a 2006 chart, showing the percentage decline in
median household incomes from 1999-2005.
Nationwide incomes dropped 6%.
Note the dark orange colors showing those states where incomes dropped more than 10%.
Note also this chart shows that incomes fell in 94% of the states (47 of the 50 states) during that period.
That's most conclusive.
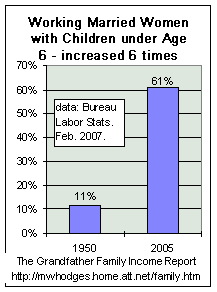 Here's another chart from the full report, showing 61% of married mothers of small children work
- 6 times more than 11% in 1950. Note > here we speak of married mothers, not single
mothers.
Here's another chart from the full report, showing 61% of married mothers of small children work
- 6 times more than 11% in 1950. Note > here we speak of married mothers, not single
mothers.
Are children better-off from a family training & discipline and education quality standpoint without a full-time mother?
Can a working mother pay more attention to the quality of schooling than a stay-at-home mom, and if not what happens to the quality of education, compared to prior generations? As proven in the Education Report chapter, the quality of education is not only below that of prior generations, but seriously below that of today's international students.
Is it all their fault, or is there something unbalanced about the economy, compared to before?
And even with these young moms going to work household debt ratios soared to new records and personal rates of saving plunged to a record low - as shown below.
If families have minimal inflation-adjusted income growth , despite mother working, then family personal savings suffer as a consequence - unless, of course, families reduce consumption and taxes.
But, families have increased both consumption and tax payments and to cover this have reduced savings to historic lows and increased household debt to historic highs. More and more of our national over-consumption is fueled by the largest international account deficits in our nation's history (see the International Trade Report chapter).
Is it all their fault, or is there something unbalanced about the economy that looking forward is detrimental to families and their children, compared to before?
 SAVINGS PLUMMET -
a record low in world history
SAVINGS PLUMMET -
a record low in world history
Many
times in recent years there has been much bragging about how productive
If the
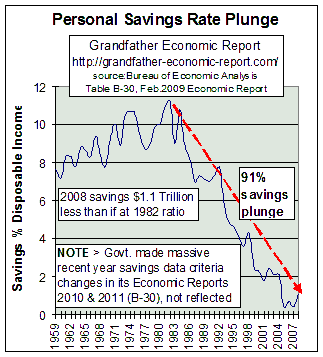
The chart at the left shows a 49-year trend of that part of disposable income that has been saved - - called 'personal savings rate'. Prior to 1970 the rate of personal savings increased smartly - - as were family incomes - despite most families then having but one wage earner while also living without huge debt ratios.
This chart shows the collapse of savings since the late 1980s, to the lowest ratio in history.
As of 2008, 91% below 25 years ago, near all-time record low!! And, as the chart indicates in that year savings were a whopping $1.1 trillion below compared to savings ratios in the mid 1980s.
Also "a record low for any leading global economic power in the modern history of the world," per economist Steven Roach Nov. 2006.
Lacking in domestic saving
Note in the graphic > reporting government making massive revisions in 2009 and 2010 to savings data citeria in more recent years compared to how measured in the past - - as if changing how one measures fixes a problem of too little savings and too much debt.
More about savings in the Family Income Report.
Disappearing personal savings and soaring debt (in all sectors) may drive consumption (and GDP) beyond personal income, but what does it mean concerning future family incomes, prosperity and economic security as such practices place our young generation more at the mercy of foreign interests?
In 2005 consumers drew down savings by over $200 billion compared to the prior year, the biggest dip in savings since record-keeping began in 1929 (Bloomberg).
$1.1 Trillion in savings was missing in 2005 compared to had the savings ratio been as 2 decades ago. (Realized capital gains/losses, if any, are not included in the personal savings calculation, and may slightly mitigate this chart if one wishes to call such savings. Nevertheless, the trend with and without is at an all-time record low).
Many gamble in stock markets and state lotteries, instead of exercising the self-discipline of saving much higher rates of their incomes, as they used to do. Is this safe for their futures, especially recognizing significant negative national trends in company pensions, social security and health insurance - - and our exploding international debt to foreigners?
Others don't save when they see their house price increase, yet they sign away future income security by refinancing to extract equity for consumption today - - which implies negative impact for their future. Will they have a free & clear home plus sufficient liquid savings as they approach retirement years as many of their parents did via discipline? Will they also have better buying power via pensions and social security than current retirees? (the Social Security Report chapter of this series proves otherwise).
Americans have not saved so little since the depression of the 1930s - they have been on a spending binge, well beyond growth of their incomes. (Bloomberg Jan 2006)
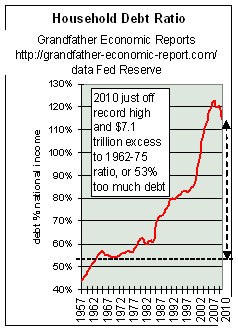 DEBT SOARS - a
record high in history
DEBT SOARS - a
record high in history
Left is another sample chart from the full report link bottom this page, and from the chapter America Total Debt Report.
It shows soaring household debt ratios during the past 2 decades of stagnant inflation-adjusted median family income growth. The chart shows that household debt increased two times faster than general economic growth.
The chart shows during the 1960s and early 1970s that the household debt ratio held fairly steady at about 53% of national income - which means household debt was not growing faster than growth of the total economy. Therefore, during this period of rising inflation-adjusted family incomes households did not increase their debt ratios.
The left chart shows thereafter, which has been a period of stagnant family incomes, the debt ratio started upward, slowly - then exploded like a rocket - to today's historic record high debt ratios (at 123% of national income, or $13.8 trillion - a debt increase of 7% over the prior year).
If today's household debt ratio had been the same as the debt ratio of the 1960s, then today's debt in dollars would have been $8.2 Trillion less than occurred. In other words, 2006 household debt would have been $4.8 Trillion, not the $13.8 Trillion that did occur. That's a HUGE DIFFERENCE !! A difference of $29,801 per man, woman and child.
As household debt ratios increased 90% faster than growth of the economy since the late 1960s when real median family incomes stopped rising, such suggests real equity & savings have not been the driving force of so-called economic growth - - it has been debt driven.
Even students are learning how to go into debt up to their necks. The federal General Accounting Office, according to AP's Martha Irvin in January 2002, says college students are graduating with an average of $19,400 in student loans.
This is an indicator of how families try to maintain their apparent living standards and consumption ("keeping up with the Jones' with nil income growth to do so). They compensate for stagnant incomes by rapidly draining savings and rapidly expanding debt - - credit cards and later the more dangerous form of credit for consumption being spending of their home equity. At the same time that families face less social security/Medicare and company benefits when they retire (than their elders), and more and more head toward their golden years more and more in debt with lower home equity and real savings (than their elders).
This chart may understate the rising debt impact on families, since it shows debt ratios for all households - - including seniors. If senior households were removed most likely the upward slope of family-only debt ratios would appear even steeper.
All ages are impacted by stagnant to nil income growth. Another example, reported April 2008 > A study released in 2007 by the Brookings Institution and the Pew Charitable Trust found that the median income of men in their 30s fell 12% from 1974 to 2004 when adjusted for inflation.(and that decreased income is much larger if inflation were measured by the same criteria after 1995 as it was prior to 1995).
|
SEVERAL
MEASURES OF SUCCESS HAVE BEEN ANSWERED |
|
Our economy has not provided for long periods of rapidly rising inflation-adjusted real median family incomes in recent decades, especially for one wage-earner families. Instead, incomes stagnated and declined during the past decade. Our economy has not provided for
steadily rising rates of personal savings from disposable income for
families. Our economy has not provided for
rising living standards with less debt. Our economy has not made it easier for families of school-age childen to make a choice for mother to stay home, if parents think that is best for children. Unlike families several decades ago which could be well supported with one wage-earner, very few of today's families realize such. |
Families
should not wait for government bureaucrats & politicians to 'save them'
- they must gain knowledge to take their own actions - - or suffer the
consequences -
- The above graphics on
the summary page
are but a few available in the Full Family Income Report
- link below. -
CLICK THE FOLLOWING LINK TO GAIN KNOWLEDGE
![]()
IN THE FULL
FAMILY INCOME REPORT,
with color pictures few have seen
- on income, debt and savings.
(Since a picture is worth a thousand words, please give those neat pictures a chance to load)
Knowledge is Power, if you have it !!!
Or - you
can also return to Home &
Contents, for a listing of all reports comparing today with prior
generations
- including a picture report on education quality -
Copyright © 1997-2011 Michael W. Hodges. The Grandfather Economic Report series is the intellectual property of its author; all rights reserved under Copyright Conventions. Permission to redistribute all or part of this series for non commercial purposes is granted by the author, provided the associated web page address is included and full credit given to the Grandfather Economic Report and the author, Michael Hodges. Notice appreciated via email.
| Home & Contents | Summary | Feedback | What's New | Eye-opener | Must See |