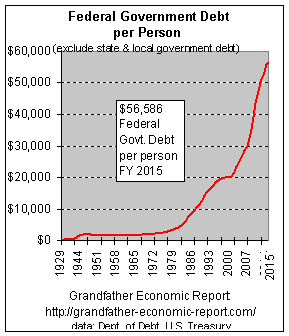
 If we divide year 2015 ending debt of $18.9 trillion by the population we have debt per person.
Grandfather Economic Report series
| Home & Contents | Summary | Feedback | What's New | Eye-opener | Must See |
|
Federal Government Debt Report |
Federal Government Debt ending year 2015 was $18.9 trillion and climbing
That's $800 Billion higher than last year,
and $2.5 Trillion increase past 3 years.
In the 1990s $2.8 trillion of new debt was created;
more than created in the nation's entire history prior to 1990
In the 4 years 1997-2001 total federal debt increased $400 billion,
a period when politicians bragged about a $557 billion surplus.
That's a $1 Trillion creditability gap.
(Some might suggest Enron, Lehman and others learned reporting gimmickry from government practices)
An additional $13 trillion of debt was added 2002-2015
- dramatic pictures below tell the story -
The Grandfather Economic Report (https://grandfather-economic-report.com/) is a series of picture reports showing threats to the economic future of families and their children, compared to prior generations. You are now at the chapter on Federal Government Debt trends. Welcome. We hope your visit will find useful information to help you and your loved ones.
This report is about the increased dependence of federal government debt, impacting families and the young, presented in an easy-to-understand format with 9 pictures. This page, with 2 graphics, is a summary of many revealing pictures included in the Full Federal Government Debt Report (link bottom of page).
Our younger generation is being loaded with a historic debt burden, caused by run-away consumptive social spending in the past 30 years - with zero plan by the generation that created it taking the responsibility to pay it off (past claims that total debt was being paid-down are bogus, since total debt increased every year).
FEDERAL GOVERNMENT DEBT of $18.9 TRILLION = $56,586 per PERSON, and rising Fast !!
 If we divide year 2015 ending debt of $18.9 trillion by the population we have debt per person.
At the left is a chart showing the rapid build-up of federal debt per man, woman and child to $56,586.
This means a family of four (4) shares $226,344 in federal debt responsibility - - including those still in diapers - that's $16,000 more debt per family than last year. And, that's not all they owe.
Our nation's founders were against debt. At the writing of the Constitution they were concerned about debt incurred to finance the Revolutionary War, and it was their intention to promptly pay it off. Alexander Hamilton (federalist paper #7) called for the "extinguishment of all debt." Thomas Jefferson later wrote, "I place economy among the first and most important of republican virtues, and public debt as the greatest of dangers to be feared."
If 2010's govt. debt ratio to national income were the same as in the early 1970s (40%), today's debt would be $4.6 trillion, a whopping $10.2 trillion ($33,009 per person) less than it is.
Is the debt going down? Nope!! In 20151 federal debt rose to $18.9 trillion - $800 billion more than the prior year, which is a one-year increase of $2,500 per man, woman and child - or $10,000 more per family of 4 - - another in a long string of new records.
During the period since the Sept. 11, 2001 terrorist attack, federal government debt increased $9 trillion. Some might say, "But isn't more debt OK to fight the 'war on terror'?" My response: did they reduce non-defense spending to fund our protection, since the major reason our founders formed a federal government was for national security? Answer: Nope!! They increased non-defense spending, too. How many senators and congressmen can you name who proposed serious legislation to significantly reduce non-defense spending in that period?
Question: Subterfuge continues, such as how could officials claim budget surpluses in the late 1990s, and that they paid down debt, when total debt increased to a new record high each and every year?
Answer: the general federal government did not have a surplus in any year in the past 20.For example > During the 4-year period FY 1998-2001 politicians claimed a $557 billion surplus, yet total debt increased $438 billion in that period - - meaning the actual situation was nearly $1 trillion over-stated, which makes such 'hide-the-debt' scandals like Enron look like child's play. The Deficit-Trust Report shows the general government spent more than its general revenues every year, and covered up over-spending deficit by siphoning-off all $ 4.3 trillion cash surpluses incoming to trust funds, including spending every penny remaining in the social security trust fund on non-pension items - - creating even more non-marketable debt IOUs to 'paper-over' their actions - - while claiming they want to 'save social security'. (If a private firm did that to its employee pension fund its officers would go to jail - a law in every state).
TO WHOM DO WE OWE FEDERAL GOVERNMENT DEBT?
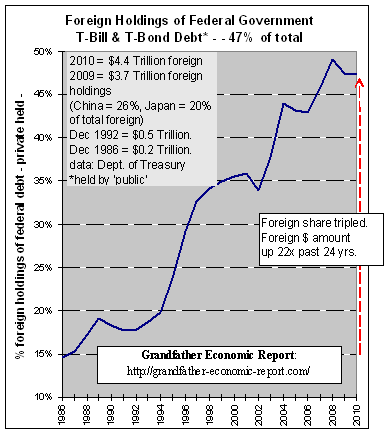
 Some like to 'hope' we owe all debt to ourselves. This chart shows otherwise.
How about a lot owed to foreign interests? Is $3.7 Trillion a lot? How about 47%? Absolutely !!
Of the $14 Trillion in total Federal government debt outstanding at the end of CY 2010, $9.4 Trillion was owed to the public (foreign and domestic) in the form of treasury bonds and T-bills. (an additional $4.6 trillion owed to trust funds).
The left chart shows foreign parties control 47% ($4.4 trillion) of $9.4 trillion of outstanding Treasury bond and T-Bill dominated debt - at the end of 2010.
This means each man, woman and child owes $14,286 in federal debt to foreign interests. A family of 4 owes $57,144 in this regard - - 26% of the total is owed to Chinese interests, 20% to Japan.
Note the rapidly rising trend since 1992, as the share of foreign holdings more than tripled.
Who was the idiot that said, "Don't worry about too much debt, since we owe it to ourselves, so its no big deal if debt goes up." This chart proves Americans owe a huge amount to foreign interests - - and that's a very serious 'deal."
AMERICA LESS AND LESS IN CONTROL OF ITS OWN ECONOMY
"Foreign interests have more control over the US economy than Americans, leaving the country in a state that is financially imprudent. More and more of our debt is held by foreign countries – some of which are our allies and some are not. The huge holdings of American government debt by countries such as China and Saudi Arabia could leave a powerful financial weapon in the hands of countries that may be hostile to US corporate and diplomatic interests.” David Walker, the US comptroller general. 23 July 2007. http://business.timesonline.co.uk/tol/business/markets/united_states/article2120735.ece
Foreign interests now own more and more of America - - According to the above chart, they own nearly 50% of federal government treasury bonds. Additionally to foreigner ownership of $4.4 trillion of federal govt. debt, foreigners additionally own at least $10 trillion of U.S. financial assets, "including 13% of all stocks, 13% of agencies, and 27% of corporate bonds," according to Gillespie Research/Federal Reserve. The major provider of money for home mortgages is Fannie Mae - - guess where they get that money > > answer: they borrow about a third from outside the U.S., according to Bloomberg Sept. 2002. Additionally, foreign interests own real estate and factories.
This spend-spend-spend with debt-debt-debt mentality of the Federal Government has in more recent years spilled over into the private sector, as debt ratios of the household, business and the financial sectors have soared to historic record highs, which is graphically demonstrated in another chapter of this series called 'America's Total Debt Report'. We have become a nation of 'debt-junkies,' living beyond our means more than ever before. And, like a drug junkie, we require larger and larger doses. Such trends cannot be sustained forever, but where is clear action to reverse?
We should not be mad at foreign interests. We are the ones consuming beyond our own production, with nil savings, creating unprecedented debts in all sectors and trade deficits, PLUS excessive federal spending.
Question 2: Where's the government plan to pay-off the total federal debt, including the $4.6 Trillion of IOUs they owe the trust funds including the $2.4 trillion owed the social security trust fund they constantly claim they want to save? Answer: No such plan exists, other than continuing to siphon-off surpluses from trust funds while 'covering' that with even more non-marketable IOUs. This does not reduce total debt - - or save anything.
Question 3: Did you know that after World War II and the Korean War America's federal government debt ratio to GDP was declining rapidly, pointing toward zero debt - and, at the same time, median family incomes adjusted for inflation were rising rapidly? That's a fact !!! Unfortunately, rapidly rising social spending ratios in the 1960s wiped out that trend. See the facts in tell-all data graphics in the full report link below.
you have just viewed the starter page of our Federal Government Debt Report
The two color graphics above are examples of others you will find in the full Debt Report, on the next page. You are invited to review and gain knowledge.
 Link to the full FEDERAL GOVERNMENT DEBT REPORT with pictures - there are 9 color graphics that tell the whole debt story - - so, give the next page time to load those neat pictures. After you scan this full report for the complete picture of debt and how it happened you can return to your favorite sections via the following Quick Links. KNOWLEDGE IS POWER - - IF YOU SEEK IT, based on hard data.
QUICK LINKS to Sub components of this Federal Debt Report:
from page 1 of 2: questions, debt dollars - 75 year trends, debt per child, debt ratios, and the culprit, and a summary.
from page 2 of 2: interest costs, international debt, foreign ownership, deficit reduction game, debt summary table of all debt, and a reduction plan .
After reviewing this Report on Federal Government Debt, you might be interested in reviewing the chapter called AMERICA'S TOTAL DEBT REPORT which, in addition to federal government debt also includes debt of state & local government, foreign debt, and private sector debt of households, business and the financial sector - all summing to $57 Trillion, or $185,065 per man, woman and child.
Copyright © 1997-2016. Michael W. Hodges. The Grandfather Economic Report series is the intellectual property of its author; all rights reserved under Copyright Conventions. Permission to redistribute all or part of this series for non commercial purposes is granted by the author, provided the associated web page address (URL) is included and full credit given to the Grandfather Economic Report and the author, Michael Hodges. Notice appreciated via email.
| Home & Contents | Summary | Feedback | What's New | Eye-opener | Must See