 The
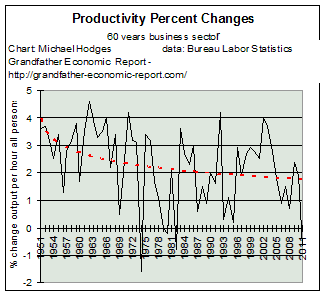
left chart shows the annual change in business sector productivity measured over
the past 6 decades - - using the Bureau of Labor's definition.
The
left chart shows the annual change in business sector productivity measured over
the past 6 decades - - using the Bureau of Labor's definition.Grandfather Economic Report series
Home & Contents | Summary | Feedback
| What's New | Link Index
| Eye-opener | Must See
|
Economic Productivity Reportby Michael Hodges updated Aug. 2011, email |
We have heard much about great U.S. productivity.
Better than ever, some brag.
But - - is it true?
(See pictures below for the facts)
Why are some hyping productivity, as if the economy is on newly-created steroids? While at the same time > > One should ask > what productivity? |
This Productivity Report is a chapter of the Grandfather Economic Reports (https://grandfather-economic-report.com/), of negative trends facing our young (debt, healthcare, incomes, savings, energy, etc.), compared to prior generations and to other nations. By high-lighting data evidence in picture form, it is hopeful more people will be better informed.
(NOTE to Reader: you will see various links in this report showing back-up data reports. Before clicking one of those links, which will take you off this page, it is recommended you first read the report completely. After you read this report in full, below are a few internal Quick Links to help you return to a particular section).
Most economists claim that high, steady growth rates of productivity and savings are a major driving force necessary to improve long-term real family incomes and living standards. I add > without resorting to added debt.
Ideally productivity rates should be increasing on a long-term path, with rates higher than the 1950's when family incomes dramatically increased with one wage-earner per family and households lived well with nil debt. This has not happened.
QUESTION:
Do families and their children deserve to inherit an economy which produces the type of productivity improvement that causes national income to rise without increasing debt, causes personal savings to rise year after year, causes the internal buying power of a dollar to rise each year, causes a trade surplus with the rest of the word and a rising manufacturing base - - with a stable foreign exchange rate of the dollar? We should hope so.
Do they deserve to realize steadily increasing real median family incomes each year, and to realize increasing foreign reserves per person?
Are we being fair with the situation being passed on to the young generation by claiming record productivity, as if all of a sudden America was more productive than ever before, when in fact we are less productive than before - - since we need more debt each year to produce national income than before, savings fall, our manufacturing base declines and trade deficits soar?
How can anyone claim improvements in national productivity if even government long-term data shows the opposite, even by its own measure of productivity?
Have we become a nation of 'debt-junkies' for our younger generation, instead of a nation truly growing real productivity?
This grandfather is not very proud of this bequest.
A few pictures will show why?
Then, you can make your own judgment regarding productivity - - backed by hard data.
QUICK LINKS - Productivity (traditional measure) Chart - - Trade Productivity - - Debt Productivity - - Manufacturing Base - - Savings Productivity - - Purchasing Power Productivity - - State & Local Government Productivity - - Health Care Productivity - - Education Productivity - - Compared to other Nations - - Dollar's International Value - - Home Equity - - Lawyer impact - - Articles on Measurement Games - - Government Size
PRODUCTIVITY GROWTH RATES - - 60 year down-trend - the traditional measure
 The
left chart shows the annual change in business sector productivity measured over
the past 6 decades - - using the Bureau of Labor's definition.
The chart proves that claims by some that the U.S. enjoys huge productivity growth compared to the past are a myth, even though this traditional measure of productivity (output per hour) disregards important stuff - - like >
>> soaring debt in all sectors, exploding trade deficits and collapsed savings - with stagnant real family incomes.
This data represents the yearly percentage change in output per hour of all persons in the business sector. (data source: Bureau of Labor Statistics).
From the left side of the chart (1951) to today it can be seen productivity rates have followed a declining exponential trend. (the red line)
In the 1950's and early 1960's productivity rates oscillated in the 3-4% range. Thereafter, productivity rates became more and more erratic with wider and wider swings as the averages trended down below the 2% rate level - which is no measurable productivity at all.
The apparent up-tick several years ago was suspect, as discussed below - - which again reversed to the downside in 2008 - and plummetted negatively by 4th quarter 2008.
Caution: its a bit disconcerting to note that during the late 1990s, the peak of a long economic expansion, such failed to produce productivity rates any where near the higher ratios of the late 1950s and 1960s when family incomes were moving up quite rapidly - - even after using new (more favorable) data measurement criteria in the past several years (see below) - - and, especially, after debt ratios to national income soared.
Now ask yourself this question > Looking at this chart can you see where this wonderful productivity has been the best ever as we have had constantly pounded into our heads? I can't. In fact, the government's own measure per this graphic has been declining over time. Wondering why we were told otherwise?
Now that we have looked at the traditional way of measuring productivity (above graphic), let's get a bit more realistic in how we think about this term.
TRADE DEFICITS INDICATE LACK OF RELATIVE PRODUCTIVITY
If the U.S. had adequate productivity it should be most competitive compared to other nations and therefore produce trade surpluses. But, instead, the U.S. produces huge, record trade deficits.
 This leads one to ask > WHAT PRODUCTIVITY?
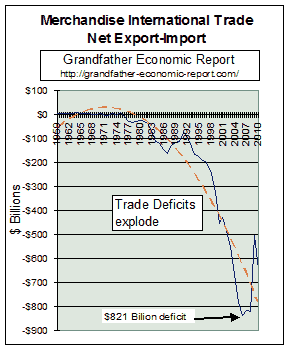
The left chart displays the trend of America's trade deficits in merchandise goods, as shown in the International Trade Report. 1985-2010 cumulative deficits totaled $8.9 trillion.
About the past several years, one writer reported: "If the US enjoys higher "productivity" why has the trade deficit exploded during recent years to new records? In an economy that is mostly based on "services", how can higher so-called "productivity" generate the funds that will be needed to repay the debts, which financed a trade deficit that consists mostly of "goods"? Will 10 million Japanese and 40 million Chinese come every year to tour the US and buy haircuts and Starbuck coffee? How can competitiveness rise as the result of higher "productivity" if at the same time the trade deficit soars - - and private sector debt ratios surge to new records? What competitiveness? Of burger flippers, salesmen and Wall Street paper creators - - and more and more debt paper?"
If it were true that productivity was higher than the past, which the chart above proves is not the case, then the U.S. should be experiencing record trade surpluses because of increased competitiveness - - but instead the U.S. is experiencing record trade deficits, indicating declining productivity if measured in a manner that makes sense.
In 2010 the U.S. had a total merchandise trade deficit of $647 billion, while Japan & Germany produced a cumulative trade surplus of $286 billion ($83+$203). That's a whopping $1 trillion worse relative trade performance for the U.S., in JUST ONE YEAR. , with just 2 nations. Those are seriously, significant numbers.
This leads one to ask > WHAT PRODUCTIVITY?
AMERICA'S DIMINISHED DEBT PRODUCTIVITY
The following is from the chapter called "America's Total Debt Report" >
If America was more productive
then less debt would be needed for each dollar of national income.
But - - the reverse is true. We are less productive regarding debt than ever before.
| Each dollar of economic growth requires more debt per dollar than before - now over twice as much | and, the national income achieved per dollar of debt dropped 57% |
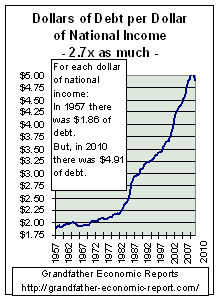 The left chart restates the above. The left chart restates the above. It shows that in 1957 there was $1.86 of outstanding debt for each dollar of national income. But, today's economy needs $4.99 in outstanding debt for each dollar of national income. That's double the outstanding debt load per dollar of national income. That extra $3.13 of debt produced zero national income. |
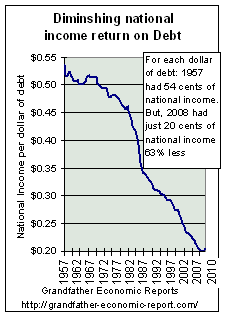 The left chart shows the reciprocal - -
and the diminishing returns resulting from debt. The left chart shows the reciprocal - -
and the diminishing returns resulting from debt. It shows the declining amount of national income achieved by the economy for each added dollar of debt. In 1957, 54 cents of national income resulted for each dollar of debt. But, today only 20 cents of national income resulted per dollar of debt. That's a 63% drop in national income per added dollar of debt. |
| The left graphic above looks at total debt outstanding vs.
national income at end of each year, which is the correct long-term approach. However, if we look at differences for just one year, 2007 vs. 2006, $4.3 trillion of new debt was added, yet national income that year increased just $608 billion - - meaning it took $7.17 of newly added debt to produce each new dollar of national income - - a huge figure, which helps explain the soaring trend above. Here's another chart from 'America's Total Debt Report' >
Now look at the left chart, from the powerful chapter 'America's Total Debt Report' It shows > America's total debt (sum of all government debt and all private debt of households, business, and financial sectors) - - started to grow faster than growth of the economy's national income - - at about the same time (late 1970s to early 1980s) - - increasing even faster today. What this says is that debt drives over-spending, over-consumption - - beyond incomes and savings. Therefore, excessive debt also drives imports - - faster and faster, driving soaring trade deficits. This chart is a ratio chart - - a ratio of total debt in America to national income. If America's debt dependence were not growing faster than the economy during this period the chart's trend line would have remained horizontal. BUT - is that trend horizontal? Nope. Its up, up and away !! AGAIN we ask our question > If we are more productive as a nation then why does it take more debt creation each year to produce national income? This leads one to ask > WHAT PRODUCTIVITY? |
|
 Decline
of the Manufacturing Base Decline
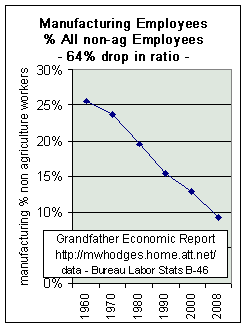
of the Manufacturing BaseIf the U.S. had adequate productivity then why should its manufacturing base shrink - - instead of grow? How can America ever export enough goods to other nations to balance its negative balance of trade of soaring merchandise imports if it has a declining manufacturing base? The left chart, from the Family Income Report chapter about stagnant income growth, shows the trend of the number of manufacturing workers as a percentage of all U.S. employees (non-agriculture) - - from 26% in 1960 to 9% in 2008, a 64% drop in the manufacturing ratio. On a GDP basis the trend is the same negative > the U.S. manufacturing base declined from 30.4% of GDP in 1953 (when we had a trade surplus) to 11.7% in 2007 - also a 62% drop in the manufacturing share of GDP - and more of the remaining manufacturing base is foreign-owned than before. (Bureau Economic Analysis table b-12, Economic Report of President, appendix table) This leads one to ask > WHAT PRODUCTIVITY? |
 COLLAPSE OF SAVINGS
NET PERSONAL SAVINGS RATE - world history record low
Many times in recent years there has been much bragging about how productive America is.
If the U.S. produced adequate productivity by a realistic measure then personal savings should soar. Why, instead, do savings plunge to the lowest level ever?
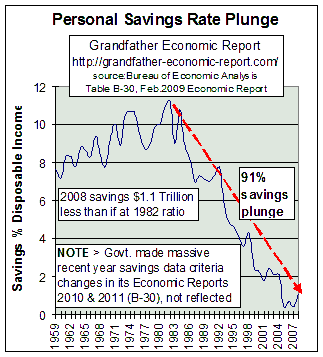
The chart at the left shows a 49-year trend of that part of disposable income that has been saved - - called 'personal savings rate'. Prior to 1970 the rate of personal savings increased smartly - - as were family incomes - despite most families then having but one wage earner while also living without huge debt ratios.
This chart shows the collapse of savings since the late 1980s, to the lowest ratio in history.
As of 2008, 91% below 25 years ago, near all-time record low!! And, as the chart indicates in that year savings were a whopping $1.1 trillion below compared to savings ratios in the mid 1980s.
Also "a record low for any leading global economic power in the modern history of the world," per economist Steven Roach Nov. 2006.
Lacking in domestic saving America imports savings from other nations. Estimates suggest America absorbed about 70% of the surplus saving elsewhere in the world in 2005-06. What kind of so called productivity is that?
Note in the graphic > reporting government making massive revisions in 2009 and 2010 to savings data citeria in more recent years compared to how measured in the past - - as if changing how one measures fixes a problem of too little savings and too much debt.
More about savings in the Family Income Report.Disappearing personal savings and soaring debt (in all sectors) may drive consumption (and GDP) beyond personal income, but what does it mean concerning future family incomes, prosperity and economic security as such practices place our young generation more at the mercy of foreign interests?
This leads one to ask > WHAT PRODUCTIVITY?
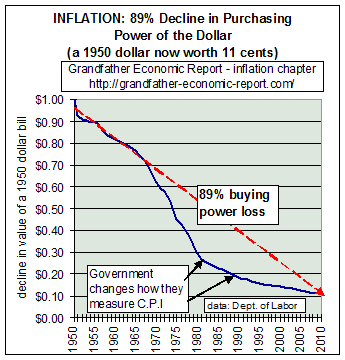 PURCHASING POWER EROSION PURCHASING POWER EROSIONIf the U.S. produced adequate productivity the internal purchasing power of each dollar should rise. Why, instead, does its buying power fall each year? This chart, from our Inflation Report chapter, shows an 89% reduction in the value of a dollar (its internal purchasing power) since 1950, where a dollar of 1950 is worth but 11.9 cents today - based on the consumer price index. For this chart, the average annual inflation rate since 1950 was about 4%. To some people 4% doesn't sound like a big number. But, compound 4% over 50+ years and the 1950 dollar is worth but 11 cents today - - as seen in the chart. (Compound it out another 50 years into the future, when today's 15-year old will retire, and the value of today's dollar will be worth just 12 - - another 89% plunge - - bringing it to a value of just 2 cents when compared to the 1950 dollar.) Adequate productivity, by a proper measure, should produce a rising line in this chart of a dollar's purchasing power - - not falling purchasing power. This leads one to ask > WHAT PRODUCTIVITY? |
| STATE & LOCAL
GOVERNMENT EMPLOYEE PRODUCTIVITY This sector employees more workers than any other sector in the national economy. How can some claim higher productivity in America if there is a negative productivity regarding state & local government employees - - since their headcounts increase each year faster than general population growth?
Most of us know each working person today is required to 'carry on their back' more seniors than any prior generation - - with less expected in return than available to current seniors. (see Social Security Report). But, few know each citizen also 'carries on their back' 3 times more state & local government employees than before - - with less education quality in return. A double-whammy!!! This chart is from the chapter State & Local Government Spending Report). In 1946 there were 2.3 state & local government employees for
every 100 citizens. That's an increased load of 4.2 more employees per 100 citizens than before. If this sector's productivity had just kept even with population growth today there would be 12 million fewer such workers in that sector, resulting in huge reductions in property taxes, sales taxes, and income taxes with much lower regulatory costs burdening today's families. If that sector had increased productivity the difference would be even larger than that 12 million excess. A 64% reduction of these employees would be required to meet the prior employee-to-citizen ratio. More often than not - - - - state & local government employees receive more job security, more time off, higher pay, better medical insurance & pension benefits and inflation protection - - than most private sector employees. And, today most local governments out-source many services (trash collection, etc.) performed by their own employees in the past - - which should reduce per capita counts, not increase them. True productivity and efficiency improvement by state and local governments should result in fewer and fewer employees per capita - - not more. QUESTION > how many state and local governments specifically show in their budgets headcount reductions from budgeted productivity improvements? Check you own local government for the answer? This leads one to ask > WHAT PRODUCTIVITY? |
 HEALTH CARE
PRODUCTIVITY - compared to others
The chapter called the Health Care Report makes the following statement, with back-up data graphics >
U.S. citizens realize less life expectancy than citizens of other nations
and the U.S. ranks only 37th in the world in quality health care -
yet nationally America spends 82% more per person on health care than others -
even U.S. federal and state governments spend more on health care than other governments
This leads one to ask > WHAT PRODUCTIVITY?
 EDUCATION PRODUCTIVITY
The chapter called the Education Report graphically shows declining education productivity, measured as quality output to inflation-adjusted spending per student.
Additionally, there is significant lagging education quality performance in math and science of U.S. students compared to those in other nations, as shown by data graphics in the International Education Report and in the International Test Report - - yet the U.S. spends more per student. That's a type of NEGATIVE Productivity.
This leads one to ask > WHAT PRODUCTIVITY?
U.S. PRODUCTIVITY COMPARED TO OTHER NATIONS
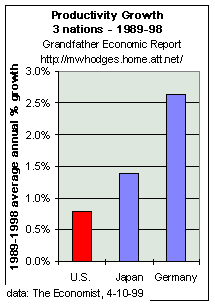 The left chart compares average annual productivity
growth of the U.S. vs. Japan and Germany - - for the period 1989-1998.
(note: these comparative rates are considered 'apples vs. apples', whereas in 1999 and 2000 the U.S. government decided to revise how they measure and thereby pump up restatements - - see article below).
Productivity is here defined as GDP per employee. Data is from Eurostat; IMF.
For proper comparisons it is important to strip-out the impact of the differing economic cycles between nations. This is best done by comparing productivity growth rates between nations for longer periods (such as in this chart) - - instead of making short-term comparisons of a year or so
This chart shows for that decade U.S. productivity growth significantly lagged Germany and Japan - which are considered major competitors for comparison purposes. In 2006, Japan's rate was nearly twice that of the USA, new EU members were 3 times better, and China's 7 times higher. (http://www.msnbc.msn.com/id/16758679/)
These same nations also far out-strip the U.S. in savings growth.
And, despite these high-cost nations experiencing a rising exchange rate vs. the dollar - as mentioned above > In the 12-months to February 2006 the U.S. total merchandise trade deficit was $789 billion, while Japan & Germany produced a cumulative trade surplus of $283 billion ($86+$196). That's a whopping $1.07 trillion worse relative trade performance for the U.S., in JUST ONE YEAR. In 2001, for the first time, China surpassed Japan as the country with the largest trade gap with the United States. America's deficit with China surged 95% in the next 3 years.
November 17, 2007 Additional evidence that the U.S. lags others in productivity. > Kenneth Froot, a Harvard university professor and former consultant to the US Federal Reserve, warned yesterday: "Part of the depreciation [of the dollar] is permanent. There is no doubt that the dollar must sink against periphery currencies to reflect their increase in competitiveness and productivity."
This leads one to ask > WHAT PRODUCTIVITY?
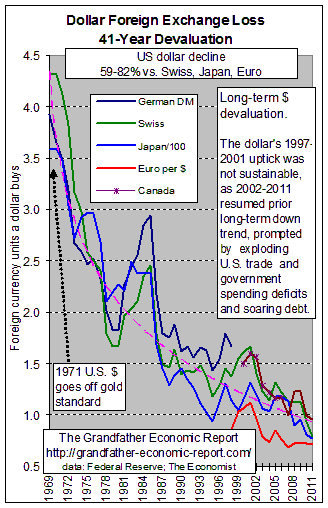 U.S. DOLLAR VALUE
- COMPARED TO THOSE OF OTHER NATIONS
If the U.S. had improving (instead of declining) productivity compared to other nations,
then the international exchange rate value of the U.S. dollar would be steadily increasing year after year.
This chart shows the opposite > the dollar's international exchange value continues to plummet, year after year.
And, after a brief up-tick, since 2001 the dollar's value has plunged to all-time new lows against most currencies.
As you look at this chart keep in mind an important point > the other nations shown are NOT low wage Asian nations.
To read more about the demise of the U.S. dollar, read the chapter called "Foreign Exchange Rate Report" - - from which this chart is posted.
Repeating from above >
November 17, 2007 Additional evidence that the U.S. lags others in productivity. > Kenneth Froot, a Harvard university professor and former consultant to the US Federal Reserve, warned yesterday: "Part of the depreciation [of the dollar] is permanent. There is no doubt that the dollar must sink against periphery currencies to reflect their increase in competitiveness and productivity."
This chart, together with the above Trade Productivity chart, provides most compelling evidence of a major consequence of the decline of America's productivity and competitiveness compared to other nations - - the continual decline in the international buying power of the currency in which Americans earn and save, vs. others. Those thinking America can forever borrow their way to prosperity, or devalue their way to prosperity, have zero legs to stand on - - and major living standard (and national security) adjustments are in store, compared to others.
This U.S. dollar chart leads one to ask > WHAT PRODUCTIVITY?
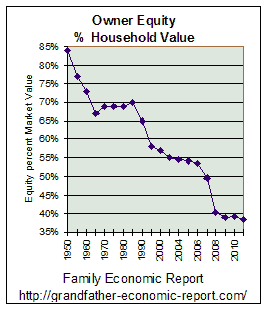 HOME EQUITY - LOWEST IN 62 YEARS
If the U.S. had real improved productivity nation-wide
then owners of homes should find the equity ratio in their homes on an upward trend,
instead of the downward trend shown in this chart.
This chart displays a sad state of affairs, since this negative trend occurred
despite rising home prices (inflation) and more mothers working than ever before.
As the years march along we find more mothers working (including those with pre-school age children), lower personal savings, higher household debt ratios and lower home equity ratios - - than ever before in our nation's history.
This home equity chart leads one to ask > WHAT PRODUCTIVITY?
NOW, FOR SOME FUN - for a change
LEGAL SYSTEM IMPACTS
QUESTION > perhaps some may believe having many times more lawyers than other nations, and adding lawyers faster than population growth increases meaningful productivity compared to our past and U.S. competitiveness compared to foreign firms today.
 USA
Leads the World in Lawyers per capita - - by a huge margin. USA
Leads the World in Lawyers per capita - - by a huge margin."America has 281 lawyers for every 100,000 people, compared to Britain with 94, 33 in France and a mere 7 in Japan." (Source - The Economist, page 35, December 16, 2000) UPDATE > 2003 data shows the number of lawyers per 100,000 citizens increased to 361 (28% more than 281 shown in the chart), according to population data and American Bar Assoc. (http://www.abanet.org/marketresearch/2002nbroflawyersbystate.pdf) Therefore, not only does the U.S. have many times more lawyers per 100,000 citizens than other nations, but the continued growth in U.S. lawyers faster than growth of the total population indicates negative lawyer productivity. Has this huge density and growth of lawyers helped improve America's real productivity, reduced debt ratios, increased saving ratos and reduced trade deficits compared to the past? It is interesting that the chart ranking of these nations regarding lawyer concentration correlates with the same ranking concerning trade competitiveness and inflation rates. The fewer lawyers the better !! Trade: while America has the highest density of lawyers it also has the greatest current account (foreign trade competitiveness) deficit ratio to GDP. Japan with the fewest lawyers has the world's highest trade surplus. Current account data 2003: USA 5% GDP deficit, Britain 2.1% GDP deficit, France 1.3% surplus, Japan 3% surplus. Same ranking in December 2000: USA 4.3% GDP deficit, Britain 1.6% deficit, France 2.3% surplus, Japan 2.5% surplus. (see International Trade Report ) Inflation: the higher a nation's lawyer density the higher it's inflation ratio, in comparison to the other nations shown. Inflation data 2000 period: USA 3.4% (with numbers by 'new methods' - see Inflation Report ), Britain 3.2%, France 2.25%, Japan 0%. From this data one could argue that the higher a nation's lawyer ratio the less competitive it is regarding international trade - and the higher it's inflation rate. The above chart suggests that once a nation has more than 50 lawyers per 100,000 person population the above correlation results. It could further be argued that by this measure the USA, with a lawyer density ratio of 281, has 5 times too many lawyers. Whatever the excess, the fact citizen trust in the ethics of lawyers reaching new lows suggests troubling implications looking forward. A November 2003 email from a reader in Austria: "One of the items in the US where we shake our heads about is the high number of lawyers taking over the whole society and literally keeping it at ransom. In Europe, if one looses a lawsuit, he has to pay all costs. This makes suing risky." |
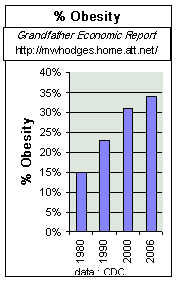 LASTLY
-
- SOME MORE 'FUN' -
- ANOTHER ITEM HELPING PRODUCTIVITY ??
From the Health Care Report - 67% of citizens are over-weight, of which more than half are obese.
One might ask -
- will rising obesity assist productivity such as to enhance higher savings, lower household debt, higher family incomes, lower medicare and medicaid costs, produce positive trends of home equity instead of negatives, trade surpluses instead of deficits, less govenerment spending, etc., etc? ?
BOTTOM-LINE
When you hear someone brag about America's wonder productivity >
Perhaps you should ask > WHAT PRODUCTIVITY?
and, compared to what ?
If you wish to read more about productivity as measured in the first chart on this page
Following are various articles on the subject.
Were past productivity data releases
based on 'pump-up' number games?
Note from the chart at the top of this page the jump for 1996-99 which seems to indicate U.S. productivity growth picked up a bit in those years. Dr. Kurt Richebacher (former chief economist of the Dresdner Bank in Germany) of The Richebacher Letter (June 1999) points out reported productivity was substantially enhanced by way of downward revisions in the calculation of the inflation rate since 1995 - - (without cranking back the new method into data for prior years). Additionally - over the years 1996-98, U.S. GDP was reported to have increased about 4% annually. Of this total for 1998 38% of GDP growth accrued from investment in computer power (they now measure increased computer power instead of volume of computer production, although computer power has little to do with true productivity). Yet, the computer industry represents just 3-4% of national employment. Essentially, this implies a correspondingly disproportionate contribution of this small sector to the economy's overall productivity performance. Taking the computer component out of GDP accounting, the larger rest of the economy really had an annual GDP growth rate of just 2.5%, with the 1998 rate being just 2% - - all resulting in significantly less productivity growth than shown.
One of the Federal Reserve consultants, Professor Robert Gordon of Northwestern University, has done a most extensive study and argues that the entire increase in recorded productivity in the American economy over the last 5 years comes from one small sector, the manufacture of computers, which accounts for only 1.2% of GDP. He illustrates that non-durables show no improvement in productivity and durables ex computers actually show a decline. His study illustrates that there is no evidence of "benefits of computers and other electronic equipment spilling over to the sectors of the economy that have heavily invested in them." Furthermore, the productivity miracles wrought in the manufacture of computers themselves only show up because of the introduction of a new measurement, not used in any other sector of the economy, which seeks to measure the change in the utility provided by computers -- the "hedonic deflator". Essentially, this is a gauge economists seek to use in order to quantify the functional capacity of the computer, meaning measuring output in units of computational power or memory capacity.
And the Economic Report of the President to Congress dated 2/2001, table B-50, shows that in 2000 previously reported productivity rates for the 1990s were restated and increased by about .05% per year by some new measurement method - - as compared to the report for Feb. 2000 and before. (For example, the increase adjustment by year was 1999 +0.3%, 1998 +.5%, 1997 +.4%, 1995 +.5%, 1994 +.7%. - - these upward adjustments make currently reported productivity appear about 20% higher, making such unreliable to compare with historical rates in the USA, and to that of other nations today).
The Economist, 8/11/01, reported, "revised figures now show most of the past-reported acceleration in productivity has now vanished - - past gains were exaggerated." (for example: year 2000 was previously reported as 4+% productivity, which was 45% over-stated according to latest revisions by the Bureau of Labor Standards). And productivity for 2001, originally reported at 1.8%, was revised (in Aug. 2002 per Labor Dept.) down to 1.1%, meaning 2001 productivity was 63% over-stated. The fact productivity has, in recent years, been consistently over-stated in original government reports and later dramatically revised downward presents creditability and market manipulation questions.
September 4, 2001, Dr. Richebacher said, "At the end of July 2001, new information came out that completely demolished the myth of American prosperity. Productivity proved to be no better than it has always been. In fact, the number is still flattered by these hedonic adjustments that they make. The real number for productivity growth is probably zero. All this new technology has made no improvement in productivity." dailyreckoning.com/
June 1, 2003. The Financial Times alerts readers that the New Era productivity numbers aren't what they appear to be. 'The core of the "new economy" has always been the sharp increase in productivity growth that began in the second half of 1995. Proponents of the new economy, led by Alan Greenspan, chairman of the Federal Reserve, have focused on this upturn in productivity growth as its defining feature. It is striking that new data, suggesting that productivity is no longer growing rapidly, have received little attention. The most recent data from the US Department of Commerce indicate that over the past year, productivity growth has fallen back to the rate of the productivity slowdown of 1973-95. If productivity continues to grow at this pace, the new economy will prove to be just a blip in a longer period of slow growth. New Era believers and the Fed Chairman have been clinging to improved productivity numbers like rats to logs in a raging river. But now we learn that the quoted numbers are "gross" not the "net" figure which includes depreciation. In other words, the output part of the productivity equation should be adjusted for depreciation. And since investment in recent years has been devoted to shorter-lived assets, including computers and software, depreciation has been increasing as a percentage of the gross productivity number. Adjusting for depreciation effectively negates the enhanced productivity argument. The gross productivity data conceal the fact that the share of output going to depreciation was increasing at a 0.3 percentage point annual rate in 1995. It is currently increasing at almost 0.8 per cent a year. In short, when the recent numbers on productivity growth are adjusted for depreciation, most of the new economy upturn disappears. It remains to be seen whether the share of output going to depreciation will continue to increase at the same rate but the gross measure of productivity growth may fall as well.' Of course, increased unemployment and exploding debt ratios and trade deficits in recent years also negate any argument about improved productivity as we would like to use the word.
NOTICE: just as we have recently seen downward revisions in past reported productivity and GDP growth, it is quite possible that the same will occur to the inflation rate's CPI since it, too, was significantly revised in the mid to late 1990s - - which will further depress reported productivity below that shown on the chart.
August 7, 2007. Labot Dept. reported productivity figures for 2004-2006 were revised downward. As an example, originally 2006 was over-stated 60%, 1.6 vs. revised to 1.0. There seems to be a pattern for government reporting of such data. Initially up-beat presented figures are released which are later (sometimes much later) revised downward as if the past is not as important as it was when it occurred and downgrading the past also makes current data when compared to the most recent past seem more upbeat than it is. Statistical revisionism in spades.
As some could say - - if you want to increase home run production redefine how you measure by reducing the distance to the left field fence.
see the Statistical Manipulation
Report
which shows major changes in measurement criteria for many areas,
including inflation, SAT scores, productivity, and others
As productivity rates became more erratic during the early 1970's and dropped, real median family incomes ceased to improve for more than 2 decades, and the incomes of full-time employed male workers began a long term decline. This forced more and more mothers into the workforce away from caring full time for their children as they tried to stem the drop in family standards of living. It was the beginning of a period of lose-lose for parents and their children - - and soaring household debt ratios. There is no evidence that having mother leave the home and her kids, and enter the work-force, helped national productivity or family incomes or household debt and savings, compared to the past. In fact, there was an intangible loss by this action - many children were required to substitute day care by others for their own mothers - - and savings fell and debt soared.
QUESTION: Would family living standards and their own growth rates be better with 4% productivity rates (and growing savings and declining debt loads) measured over longer periods, compared to current trends?
During this period of declining productivity rates, the private sector share of the economy was continually diminished as combined government (federal + state/local) spending increased in share of the economic pie from 26% to 44%, as measured by national income data. (see pictures in the Private Sector Report). In other words, as the economy became 50% more dependent on government spending, productivity rates fell.
The Tax Report shows graphics demonstrating the average person now works 5.3 months per year only to pay all federal and state/local taxes - - 4 times more months than the 1.4 month average required before. That 400% increase in consumption of a worker's time devoted to cover taxes did not enhance national productivity or Foreign Trade competitiveness - - or, Family Net Incomes and values.
PRODUCTIVITY FUTURE - no growth rate improvement in sight
'Despite spending on new technologies growing rapidly in real terms, it appears overall productivity growth rate has remained stubbornly constant during the economic expansion. Members of the "new paradigm" school believe that rapid technological change and global competition have permanently and significantly increased the economy's productivity growth rate. Adherents of the new school of thought overlook the fact that technology and globalization will change the structure of the American economy in uneven ways. When global corporations use modern technologies to restructure their operations, their productivity may increase, but their displaced workers may find jobs in other economic activities with lower productivity. When computer technologies bid up the demand and wages for college-educated labor they may reduce the demand for high-school-educated workers. There is simply insufficient evidence to demonstrate that the economy will enjoy higher productivity growth rate in the future. Consequently, old wisdom will serve America better than new paradigms.' (from article by Laura Tyson, economics professor, U. of Cal.-Berkeley in The Economist's 'The World in 1998'- pg.58-59)
Author note: the Education Report shows the severe quality problem with public secondary schools - - such as lower SATs than in the past, large percentages of college freshmen require remedial courses for that not learned in high school, etc., etc. - - despite record high inflation-adjusted spending per student. The chapter on colleges shows a reduction of admission and course standards to meet lower quality of incoming high school graduates, and the chapter on International Education shows serious problems relative to foreign students.
Clearly, until America seriously restructures its public school system to meet the demands of parents and the marketplace, future productivity, family savings, job security and living standards may suffer - - as compared to many foreign competitors - - and as compared to many of more recent generations prior to the 1970s.
DECLINE IN PRIVATE Sector's SHARE OF ECONOMY
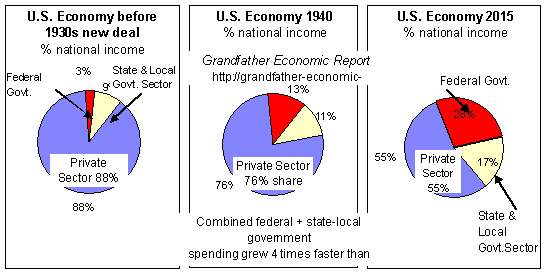 At the left are comparative charts of our economic
pie pre new-deal vs. post world war II (1947) vs.today.
Note how the private sector share of the economy (the blue slice in the pie chart) was reduced by assault by both federal and state & local government expansion.
The private sector's share of our economic pie was reduced from 88% of the economy to a 57% share, due to government expansion..
Such a large transfer of resources from the private sector to the government sector has a significant negative impact on long-term national savings & productivity growth rates, and therefore on growth in standards of living.
And, since the private sector is now smaller in its relative share of our total economic pie, private sector productivity growth is both smaller and renders less national impact on family living standard growth
This chart does not take into account the further negative impact to the private sector's share resulting from increased regulatory compliance costs mandated to the private sector.
Question: What would be the national savings & productivity growth rates and trends had government not expanded its share of the economy, especially in consumptive spending (see Federal Spending Report), or its mandated regulatory cost impacts? (see Regulatory Compliance Cost Report).
COMPLYING WITH THE TAX CODE - lost productivity for everybody
Speaking of the Regulatory Compliance Cost Report, here is a perfect example of how government mandates REDUCE PRODUCTIVITY for nearly every citizen > the huge costs of complying with the tax code. Compliance costs in terms of time have skyrocketed from an average of 17 hours and 7 minutes fifteen years ago to 28 hours and 30 minutes today. Lost productivity is in the billions of hours. The cost in dollars is now about $200 billion.
There can be little doubt that the trend in REAL PRODUCTIVITY, meaning debt, trade, government employee headcount, purchasing power & savings rates must be reversed strongly on a long-term improvement path if we are to realize long-term up-trends in standards of living for our youth during their working and retirement years. To accomplish this there must be a reduction in that part of the economic pie dependent upon government spending in favor of a significant increase in the share of the economy that can produce productivity growth at higher rates - - meaning an increase in the private sector's share of our economy by reducing government spending.
Bottom-Line > We must not be mis-led by so-called 'productivity' growth.
SHOULD WE DO BETTER IN THE INTEREST OF OUR YOUTH ?
For more information, read the following report>> Federal Spending Trends
- and America's Total Debt Report, the International Trade Report, the Federal Government Debt Report and the Family Income Report found on the HOME PAGE -
This Productivity Report is frequently updated at > https://grandfather-economic-report.com/product.htm
| Home & List of Reports | Summary | 12 Questions | Feedback | What's New | Link Index | Eye-opener | Must See |
Copyright © 1997-2011 Michael W. Hodges. The Grandfather Economic Report series is the intellectual property of its author; all rights reserved under Copyright Conventions. Permission to redistribute all or part of this series for non commercial purposes is granted by the author, provided the associated web page address is included and full credit given to the Grandfather Economic Report and the author, Michael Hodges. Notice appreciated via email.