 We were surprised several times in the 20th century, and on 9/11/01. Will we be surprised again?
After a 50% reduction in U.S. forces in the 1990s, is our military spread too thin?
Grandfather Economic Report series
| Home & Contents | Summary | Feedback | What's New | Link Index | Must See | Eye-opener | E-mail
|
National Security Report |
(Note: although the original of this report was prepared before the 11 Sept. 2001
Terrorist attack in New York and Washington,
its updated findings are most pertinent today - - perhaps more so)
 We were surprised several times in the 20th century, and on 9/11/01. Will we be surprised again?
After a 50% reduction in U.S. forces in the 1990s, is our military spread too thin?
But, the big issue is:
Does the U.S. have the economic capacity to meet a major war threat against major powers as faced by the World War II generation?
Answer: maybe not ! Seven (7) chart pictures below speak loudly to the challenge.
The Grandfather Economic Report is a series of picture reports showing threats to the economic future of families and their children, compared to prior generations - - from incomes to debt to education quality to health care to international trade balances. It's a free, public service to enhance knowledge. You are now at the brief chapter on National Security, a potential threat facing our young generation. Welcome. We hope your visit will find useful information to help you and your loved ones. Knowledge is Power.
QUESTION: Should we bequeath to our young generation the economic war-time surge capacity to meet future national security challenges equivalent to that bequeathed to the generation immediately preceding World War II - - or leave them with less equivalent capacity?
That's an important question - since a recent retiring chairman of the Joint Chiefs of Staff said, 'America has a very poor record of predicting in advance such challenges.' We were surprised by the demands of World War II. In the future we may be so surprised again.' And, a professor at the Military Academy writes about ' Self-Delusion, Military Weakness, and the Threat to Peace Today.'
Are we ready? The purpose of this report is to explore this issue, and to solicit input from others.
SUMMARY OF FINDINGS - - In December 1941 the U.S. was surprised when Japan wiped out a huge chunk of our military power in its devastating attack at Pearl Harbor, followed 5 days later by Germany's declaration of war. Within a week America faced a major 2-front global war, World War II - - against formidable opponents and without credible allies of our own. America had to build up nearly from scratch its capacity to defend itself and retaliate. The necessary war-time mobilization economic surge consumed an extra 39% of the economy, as said amount was transferred from the private sector to federal government spending (factory conversions, equipment, draft, etc.). Had our nation not had the private sector capacity at that time to deliver this economic surge the outcome would have been quite different. Providing a war-time surge requires that a nation's private sector's relative size to the total economy is not only large enough, but sufficiently manufacturing-based - - since this surge reduces the relative size of the private sector's share of the economy due to its mobilization to a war-support function.
This report will demonstrate that today's economy has significantly less capacity to support the equivalent economic war-time surge mobilization transfer potential as was needed to meet and sustain that required for a conflict as demanding as World War II.
REASON - - Today's private sector, from which the economic capacity of a war-time surge must come, is a much smaller share of the total economic pie than prior to WW II - - because the non-defense government share of the economy (and its mandated regulatory compliance cost) has doubled since then - - and our relative manufacturing base has significantly decreased - - and because our nation as a whole has become more debt-dependent than ever before while recording record deficits in foreign trade compared to surpluses before - - and with the lowest personal savings in history. Defense spending ratios have been significantly reduced and are nearly the lowest in 53 years. Most likely similar reductions occurred in intelligence capacity to foresee ominous threats . Readiness to sustain a major 2-front war against major powers on the ground has also been significantly reduced - - perhaps even insufficient to cover a major war on just one front.
In addition to its reduced private sector share of the economy, America's defense spending is a significantly smaller portion of total federal spending than before, and the nation is running massive trade deficits as the world's largest debtor nation while before it was a major creditor nation with trade surpluses, its manufacturing base has significantly declined, and America is now dependent on 62% of its oil from abroad compared to the time of World War II when we were self-sufficient regarding oil and even an exporter of oil.
And, trying to play world policeman and failing to face up to the new conditions posed by the end of the Cold War has stretched thin our significantly reduced military capacity to protect America's homeland.
This report will show the basis for the claim regarding loss of economic war-time surge potential
- - using seven (7) easy-to-understand pictures,
since a picture is worth a thousand words.
Readers are invited to submit comments and additions to this page to Michael Hodges, author.
(note: much similar concern expressed in this report is confirmed by the excellent book, "While America Sleeps" by a Military Academy professor - - link at bottom)
FIRST - - a little history, and then the 7 pictures - -
Today We Celebrate a Nation FREE OF WAR - our founders #1 priority
and - - we want to keep it that way
As of the late 1990s, today's generation could celebrate a nation safe and at peace, compared to the past.
But - - we must be sure we are more prepared than before, instead of less.
- the following picture study demonstrates that America may be more vulnerable, than ever -
an evaluation of the threat
to cover a major war-time economic surge
Let us embark on a quick study of the economic war-time surge capacity that historically might be needed to prosecute the equivalent of a WW II type security challenge against major adversaries, and see if today's economy could support that level should another such conflict face our younger generation during their lives. A few historic charts will assist this process
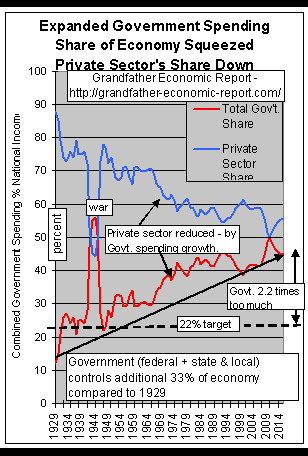 Since successful military capacity is related to the potential of the private sector to support a large economic war-time surge, if needed, it is instructive to first compare the relative size of the private sector today to that before, during and after WW II and see how today's surge potential compares.
This chart shows a 79-year history of the private sector (blue line) share of the economy, compared to the relative size of the federal plus state & local government sector spending share (red line) of the U.S. economy. (the chart is from the Government Spending Report). Today's spending ratio is 45% of national income.
Note the huge down-draft of the private sector (blue line) share of the economy during the 1940s, which resulted from the equivalent upward jump of the government spending share of the economy (red line).
That red jump was the World War II war-time economic surge to support men and factories transferred from private sector to military needs - - equivalent to a total economic shift of more than 30% of the entire economy..
Now - - what happened at the end of the 1940s, right after the war? Did our leaders do the right thing? The apparent answer is YES. The chart shows that by 1947 the red government line dropped back near it's pre-war level, as said economic resource demands were transferred from government's economic share back to the private sector (blue) from whence they were 'borrowed' for war-time purposes.
By returning the private sector line to near its pre-war level the private sector, once again, had recovered its pre-war capacity to economically support future such surge requirements should they be needed at another time. The size of the post-war government cut-back was a very proper result - - protecting our future.
Now to the problem - - What happened after 1947 to preserve future war-time surge capacity? Answer: it deteriorated, remarkably so.
After 1947 this chart shows the government spending started ratcheting upward, from 22% share of the economy to today's 45% level twice as high, as shown at the right edge of the chart. And, as a result, the economy remaining to the private sector dropped from a 78% share down to about 55%. This means the war-time surge potential has been reduced about 23 points since WW II.
(The Government Growth Report covers the shift over time resulting from government growth
Before we look at the WW II period in more detail let's look at a break out of the left chart's red line, which includes both federal, state & local government spending, and look only at the federal government's spending ratios for select years.
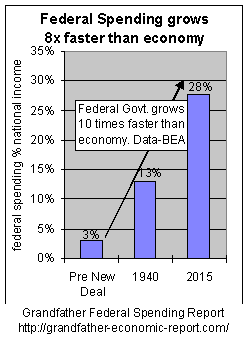 This chart (from the Federal Spending Report) shows growth of federal spending as a percentages of America's total economic pie - -
for 1929 (before the New Deal social programs) - - 3% of the economic pie,
for 1940 (just before the World War II) - - 13% of the economic pie,
and, today - - 27% of the economic pie. As seen, over time federal government spending has consumed a larger and larger share of America's total economic pie.
Note in 1929 (the left bar), before the New Deal social programs, total federal spending accounted for but 3% of the entire national economic pie.
The middle bar shows that just before WW II federal spending was 13% of the economy.
Today's ratio is 27% of the pie, as shown by the right bar - -
8 times higher than the first bar.
Several charts below look closer at the World War II period, as we zero-in closer and closer to our target - -
the size of a major economic war-time surge.
But first, let's look at defense spending itself, in comparison to non-defense spending of the federal government.
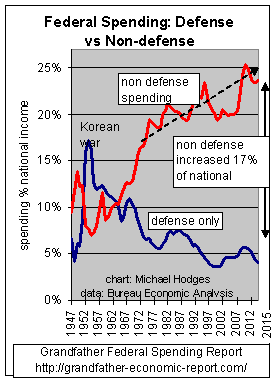 In the first chart we saw impact on the total economy due to the economic war-time surge to meet World War II challenges.
This chart is for the 60 year period since the end of World War II.
It breaks down all federal government spending into just 2 curves. Defense vs. non-defense.
The black curve is defense spending (as a percent of national income).
After defense rising from about 6% of national income in 1947 it increased to about 17% of the economy during the Korean War.
We call that jump the Korean war-time economic surge - - a jump consuming about 11% of national income.
Thereafter it declined for the next 54 years - - reaching today's level of about 5.5% of net national income.
This declining defense spending ratio partly camouflaged the huge spending increases in the non-defense parts of government - - shown by the red curve.
In other words, declining defense spending ratios were not returned to the private sector from which they had been extracted to cover the Korean war-time surge.
Instead, defense cuts were retained by the federal government to support more and more social spending. More on this later.
We have looked at defense vs. non-defense to gain that perspective. Now to defense only.
TREND OF DEFENSE SPENDING
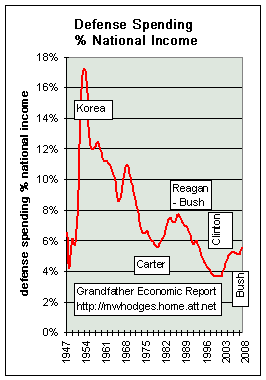 Now - let's look just at the defense spending curve over this period.
This chart shows the trend of defense spending as a share of the economy's national income.
Note right after World War II (left on chart), in 1948, defense was about 4% of the economy, jumping by 13 points to over 17% of the economy during the Korean War (we call this the 'Korean war-time economic surge').
Since that time the defense spending ratio trended downward for the next 27 years, falling to below 6% at end of the Carter administration.
The defense ratio rose 2 points, to 8%, during the Reagan-Bush era to finance a dramatic face-down of the Soviet Union and thereby close-out the 5 decade cold war. (it is noteworthy that this 2 point surge in defense was off-set by a reduction in non-defense spending ratios).
Despite the 2% surge to close-out the Soviets, the Reagan-Bush era' defense ratio ended about where it started before that era - at a 6% defense spending ratio.
During the Clinton era defense spending was slashed. By 2000 it had been cut to 3.7% of the economy's national income - - the lowest ratio in 53 years.
As noted at the top of the page, between 1990 and 2000 our military had been cut virtually in half; the number of army divisions has been reduced from 18 to 9, the navy has shrunk from 600 ships to 300, and the number of air wings has declined from 36 to 18.
In 2001 (Bush administration) the slide in the defense spending ratio halted at 3.7% of national income by end of fiscal year 2001, at about the time of the Sept. 11, 2001 terror attack on New York and Washington. In 2002 defense spending increased to 4.1% per this chart, to 4.6% in 2003 and to 5% in 2004 & 2005 and to 5.5% in 2008.
Now let's zero in on the World War II period.
Here's a powerful graphic that moves to our target - the World War II spending surge.
It shows total federal government spending ratios just before, during, and right after World War II.
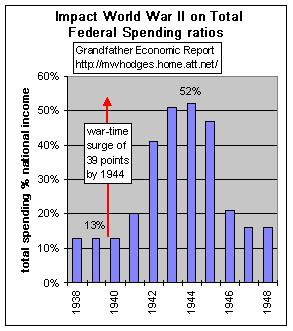 This chart is a blow-up of the spending ratios of the entire federal government (defense plus all other categories), for the 3 years leading up to the war (1938-40), the war years (1941-1945), and the 3 years following the war (1946-48).
Note: the 3 years before the war (1938-40) - federal spending consumed 13% of the entire economy. For the war years, this spending surged each year - - peaking in 1944 at 52% of the economy.
This war-time surge, from a pre war ratio of 13% to a 1944 peak of 52%, was a transfer of an additional 39% of the entire economy from private sector to government spending. For this report, the author calls this a 39% jump the 'economic war-time surge.'
Note after the war, spending ratios were reduced to a 16% - - although not quite to the pre war 13% ratios.{See raw data for this chart - - from data-base submitted by Nobel laureate Dr. Milton Friedman. (see tribute to Dr. Friedman)
Do you wonder what it would look like today if, to meet an equivalent war-time economic challenge as we faced in the past, we needed to add 39 points to current spending ratios? See the next chart.
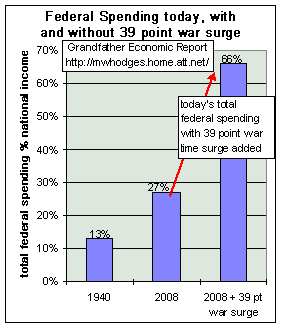 The left chart for federal spending ratios shows:
1940 (the left bar) represents the federal spending ratio for the WW II pre-war period - - with its 13% federal spending ratio.
2008 (the middle bar) is shown with today's federal spending ratio - - at 27% of the national income's economic pie.
Now, if we add a 39 point 'war-time surge' to the 2008 spending ratio - - we get the third bar - where federal government spending consumes 66% of the entire economy.
Adding this 66% federal government spending ratio to the state & local government spending ratio of 18% would push the 3rd bar up to an 84% total government spending ratio for the economy.
But, that would only leave a private sector with 16% of the economy to function - - which just about equals today's private sector's cost of complying with government regulations (being 14% of the economy per the Regulation Cost Compliance Report).
Could the American economy function with only 16% of the economy in the private sector with 84% in the government sector control, while also considering that total private sector debt today is at the highest ratio to national income in history, including a large portion of that owed to foreign interests - - and personal saving ratios are at historic lows?
Prior to World War II America was a creditor nation. Today America is the largest debtor nation in the world - - by far.
Prior to World War II America was a major net exporting nation, with its powerful manufacturing industry. Today America is running more than a billion dollars per day in the red regarding international trade, with a manufacturing industry a much smaller share of the economy than before.
To this observer - - all the above raises a big red warning sign.
What do you think?
We have our answer to the opening question.
Following are comments presented to stimulate thought on this subject.
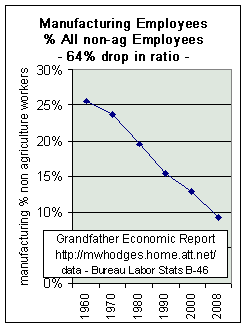 From the Family Income Report we have learned that the trend of the number of manufacturing workers as a percentage of all U.S. employees (non-agriculture) - - from 26% in 1960 to 9% in 2008, a 64% drop in the manufacturing ratio. On a GDP basis the trend is the same negative > the U.S. manufacturing base declined from 30.4% of GDP in 1953 (when we had a trade surplus) to 11.7% in 2007 - also a 62% drop in the manufacturing share of GDP - and more is foreign-owned than before. These trends are most alarming when it comes to asking the question: from where will come the manufacturing capacity and expertise to provide the proper military equipment and replacements for a major 2-front war, since U.S. manufacturing today is but a shell of what it was during the WW II period? Out-sourcing consumer goods is one thing, but depending on foreign suppliers for vital military equipment during a major war is another. Clearly, the U.S. is more vulnerable in this regard than before.
"After World War I, the "war to end all wars," we scaled down to virtually nothing. In World War II, we were able to build up because we had this magnificent monumental manufacturing might. We don't have that anymore. And a lot of that manufacturing ability has gone straight across the Pacific Ocean to China. China has a huge military-industrial structure in place that it can use to turn out missiles and tanks and planes - - much financed by its trade surplus with the USA. Which is exactly what we did when the Second World War started, in converting plants into manufacturing military munitions. We couldn't do it again today." April 2001, Geoff Metcalf interviews China expert Steven W. Mosher (see Links).
11. Energy-dependence on others -
When the U.S. entered World War II not only was its private sector a larger share of the economy compared to its significantly smaller share today (as covered above regarding significantly reduced war-time economic surge potential), but America's defense spending was a much, much larger share of total government spending than its share today.
During that war America was a creditor nation with the capacity to pay for all its import needs with export earnings (not today's largest debtor nation on earth with exploding trade deficits), and America's manufacturing base was a significant portion of the total economy, unlike today's declining base.
AND - during World War II America was energy self-sufficient since it then produced all oil and natural gas needed, and even exported oil to others. The Energy Report graphically shows today America has lost its energy independence, since its oil production peaked in 1971 and reserves continue to decline with today's oil production now back to the level of 1950, and declining - - as we now import 62% of needed oil and more and more of needed natural gas to makeup for declining domestic production vs. soaring consumption at the same time that other nations demand more energy and all sources of supply have declining reserves - - which will cause increased tensions over oil in the future between most nations.
12. Cost of Iraq Military operations now 4 times per soldier than in WW ll.
The Second World War, when 16.3 million U.S. troops fought in a campaign lasting four years, cost (in 2007 dollars, after adjusting for inflation) about $5 trillion. With virtually the entire armed forces committed to fighting the Germans and Japanese, the cost per troop (in today’s dollars) was less than $100,000 in 2007 dollars. By contrast, the Iraq war is costing upward of $400,000 per troop.
Feb. 2008 data source > http://www.timesonline.co.uk/tol/comment/columnists/guest_contributors/article3419840.ece
All of this, including our accelerating energy challenge, points toward major living standard and national security implications facing our young generation - - perhaps more so than faced by their parents and grandparents. We cannot allow this danger to be passed along. Therefore, the Federal Government must concentrate more on the number one reason for its establishment, National Security, and less on the overwhelming menu of stuff not sanctioned by our founding forefathers.
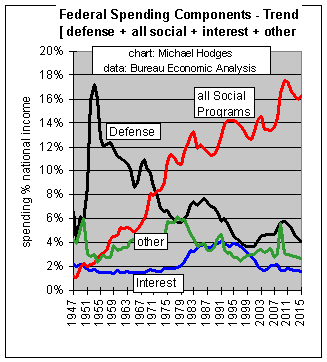 How did we get into this situation?
Answer: by deviating from the four core reasons for a federal government as specified by our nation's founding fathers.
We later added a 'fifth principal' - - called 'Social Spending' - - as shown by the red line in this chart. Note > after WW II (1947) the red social spending (as a % of our total economy) made a dramatic upward march - - from about 1% of our economy to a 15% share today.
This means social spending over that period increased 15 times faster than the total economy.
As social was zooming upward, look at what was dropping in share. It was the black line - - defense spending ratios.
Yet - - our founders insisted that Defense was Principle No. 1 for having a federal government. No longer !!
Therefore, the culprit is social spending - - an area of federal government activity not planned by our founders and the very one that has eaten into the 'defense surge potential' of our nation - - in addition, of course, zooming debt-dependence (especially to foreign interests) compounds the danger - yet debt, also, was a No-no to our forefathers.
Did our nation's founders get it wrong, or has the U.S. embarked on a threatening course concerning its long-term security and living standards?
Note: a further discussion with other pictures regarding this chart is covered in the Federal Government Spending Report.
TAKE ANOTHER LOOK AT THE CHARTS ABOVE TO BE SURE YOU UNDERSTAND
IF YOU DO, YOU UNDERSTAND A POINT MOST AMERICANS DO NOT KNOW
SHOULD WE DO SOMETHING ABOUT THIS ?
IS AMERICA'S NATIONAL SECURITY SECURE ENOUGH ?
and - within the diminished government sector restore national defense (the number 1 reason for a federal government) to its proper share, while resolving our energy dependence on others - - and devote less federal government attention and resources to those items not included in our founder's 4 principles for forming a federal government. Additionally, take actions in our economy to reduce debt ratios in all sectors back toward those just a few decades ago, and reduce U.S. dependence on foreign interests regarding debt, savings, energy and manufacturing of sensitive goods.
More on the serious national security situation can be found in the book and audio by Professor Kagan, Military Academy,'While America Sleeps' - - Self-Delusion, Military Weakness, and the Threat to Peace Today - - in the Links section.
I would appreciate email from others with views and data to help make this report as accurate and useful as possible.
Michael Hodges via E-mail
For those interested in learning what others have to say about the Grandfather Economic Report series, see Feedback.
Check out the HOME Page & table of contents of the Grandfather Economic Report - a collection of picture reports showing other economic threats facing families and their children, compared to prior generations - -
on: family income, debt, savings, government spending and size, trust funds, education quality, social security, regulations, taxes, inflation, productivity, foreign trade and exchange, voter turnout, trust, celebration, national security, energy, and health care/life expectancy.
| Home & Contents | Summary | Feedback | What's New | Link Index | Eye-opener | Must See |
Copyright © 1997-2009 Michael W. Hodges. The Grandfather Economic Report series is the intellectual property of its author; all rights reserved under Copyright Conventions. Permission to redistribute all or part of this series for non commercial purposes is granted by the author, provided the associated web page address is included and full credit given to the Grandfather Economic Report and the author, Michael Hodges. Notice appreciated via email.