 INTEREST ON FEDERAL GOVERNMENT DEBT
Grandfather Economic Report series
| Home & Contents | Summary | Feedback | What's New | Eye-opener | Must See |
|
Grandfather Federal Government Debt Report |
interest, international ownership, debt reduction, debt summary table
| This is the 2nd page of the Full Federal Govt. Debt Report - - showing color graphics on interest costs, interest per hour, international debt, foreign ownership, U.S. Federal Debt vs. rest of world, deficit reduction game, a debt summary table of all debt, a debt reduction plan and 200 years of debt. It is presumed you have completed reading the first page of the Debt Report, showing 69-year debt trends and the cause of the debt.
"I place economy among the first and most important of republic virtues, and public debt as the greatest of the dangers to be feared." -Thomas Jefferson to William Plumer, 1816. |
| This Debt report is a part of the Grandfather Economic Report series, revealing negative economic conditions facing families and their children, compared to prior generations. |
 INTEREST ON FEDERAL GOVERNMENT DEBT
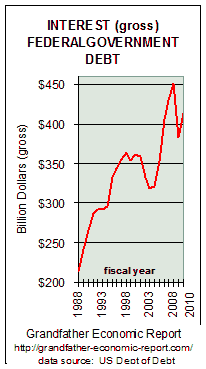
How much is it? Answer > $50 million per hour !! Left is a chart of gross interest on the federal government debt.
Although debt soared to a new record high of $10 trillion interest fell for several years (due to historic low manipulated interest rates, effectively siphoning-off senior citizen interest earnings on their savings) - but is again zooming up and away. Total interest over the period shown in the chart increased from $214 billion per year in 1988 to $451 billion in 2008 - a 110% increase.
On a per person basis, annual interest cost rose from $874 per person in 1988 to $1,400 per person in 2010. How did that help family savings and living standards (see Family Income Report)?
This increase occurred despite falling interest rates, and despite piles of extra revenue from the 2 largest tax increases in history which in the past several years produced the highest tax revenue percent GDP in peace-time history. (see Tax Report).
The 20 year sum was $8 Trillion in interest, equivalent to $25,974 per person over that period - or $103,898 per family of 4. To further place that sum in perspective: this interest was enough money to run the entire federal government for 2.5 years without any other revenue - - or enough to run all state and local governments (nation-wide) for 3.5 years, or run social security for 11 years without any FICA taxes, or run Medicare for 18 years. Its also 3 times more than necessary to buy back all those treasury bonds and notes held by foreign interests, as will be shown in a later chart.
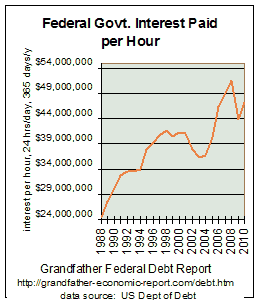 The left chart shows the trend of debt interest spent per each and every hour of the year. The 2010 figure is equivalent to more than $47 million in interest per hour, 24 hours per day, 365 days per year. That rate of interest is $27 million per hour higher than 1988 - despite lower interest rates in the market-place than before and high federal tax collections as a share of the economy in history.
For 2010 gross interest was $414 billion. However, government budget data claims they only 'spend' what is called 'net interest' which for 2010 was $196 billion. That $217 billion difference between gross and net is the amount that government should have paid to such major 'off-budget' entities (like the social security trust fund) for surpluses general government had siphoned-off for other spending, but did not pay the owed interest in cash and instead gave the trust funds internal IOUs which are not marketable yet drove the debt even further up. This practice allows government to claim they did not spend that money (although they owed it), and thereby understate the budget deficit (and further increases federal debt) by said amount. So, not only is the social security trust fund (for example) holding non-marketable IOUs instead of marketable assets for the FICA surplus payments (because all the surplus was siphoned off for non-pension spending), but it is also holding internal IOUs (instead of marketable assets) for all interest owed it for all the surplus siphoned off from the trusts by the general government. (see the Trust Fund Report "where's the trust fund surplus" for discussion on how funds are siphoned from trust funds for non-pension use, leaving behind non-marketable IOUs while understating the budget deficit).
Eliminating the deficit is insufficient. The debt principal MUST be eliminated !!
This requires a reduction in spending, as it has been proven that raising taxes will not fix the problem - - as all tax increases are always consumed in more spending plus debt increases, instead of debt reductions. Will this make the living standards of our young better ??
$6.1 TRILLION INTERNATIONAL DEBT BUILD-UP in CURRENT ACCOUNT
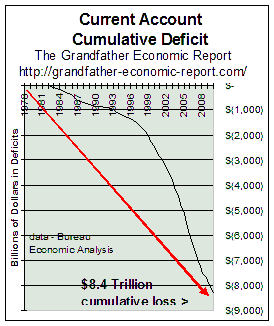 The left chart shows the trend of our cumulative international Current Account deficits.
As we purchase more from foreign nations than they from us, and as their investment income from their US investments (including interest they earn on their ownership of many of U.S. Treasury bonds) grows faster than ours invested in their nations, we owe them the difference. The Current Account is the broadest gauge of the country's trade performance, because it not only measures trade in goods and services, but also investment flows between nations.
This has now reached $7.4 Trillion - - which is $24,026 per man, woman and child in America (96,104per family of 4) - - most of which occurred since the 1980s.
In just one year (1998) our current account deficit was more than $200 billion, which is about the same we spend on our total Medicare program. By 2008 it has exploded.
Note the red dash line - that's the computed polynomial trend line - - a direction to a pile-up of more and more international debt.
"The deficit continues to be driven by poor U.S. performance and the rapidly rising tide of interest and dividend payments to foreigners who hold an ever increasing share of the American economic pie. Longer term, we run the risk of giving up more control of the economy." Michael Fenollosa, economist at John Hancock Financial Services to International Herald Tribune, 3/97.
The U.S. is now the World's largest debtor nation, compared to being the largest creditor in my generation - which means foreigners now own more U.S. assets than Americans own overseas.
For a full report on trends of the current account and our merchandise trade, as well as the fact the U.S. is 3.5 times more dependent on international trade than before - and we are not winning that challenge - see the International Trade Report. and its many color graphics.
GUESS WHAT FOREIGNERS ARE DOING WITH SOME OF THAT MONEY
TO WHOM DO WE OWE THE DEBT? How about a lot to foreign interests? And, a higher percentage each year.
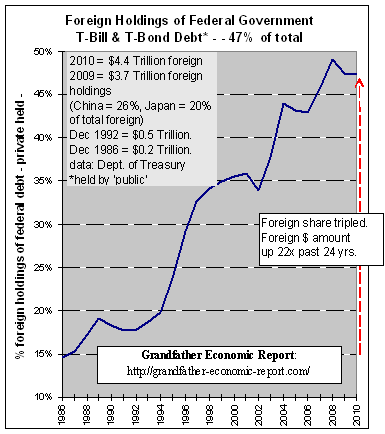 Guess what foreigners do with all that cash they earn from our massive international trade deficits, as shown in the Trade Report? They use some of it to buy up liens ('mortgages') against our national government, by purchasing outstanding Treasury bonds and notes - - which we issue as debt securities to gain cash to cover our internal debt caused by excessive federal government spending. We like their money. We spend it, and place ourselves increasingly in debt to them.
The total federal debt in fiscal year 2007 was $9 Trillion. Of this amount, $4 trillion was owed to trust funds (such as to Social Security) for trust fund surpluses siphoned off and spent on non-trust fund activities (see Trust Fund Siphon Report). The remaining amount of approximately $5 Trillion in federal debt is owned by and payable to what the Federal Reserve calls the 'public,' from whom the federal government borrowed and gave T-Bonds, T-bills, etc. in return. But, the 'public' does not mean only U.S. citizens - - it means anyone in the world who owns those IOUs, with a right to the principal and interest pertaining to same.
This chart shows that, according to Federal Reserve data, $4.4 trillion of this 'public' debt, rising to a new record over 47%, is owed to foreign investors and foreign central banks - - not to U.S. citizens. Note the rapidly rising trend in the past several years, as the share of foreign holdings zoomed upward since 1992.
This chart means that each U.S. man, woman and child owes $14,286 in federal debt to foreign interests, because of our nation's excessive federal spending and our consuming more from the rest of the world than we produce. A family of 4 owes more than $57,144 in this regard, including those in diapers.
So, my grandchildren will not benefit from that, unless a lot of caring foreigners include them in their wills. Lacking such generosity, our kids must face that debt to others, which we so 'benevolently' pass to the next generation.
And this $4.4 Trillion does not include the added amounts foreigners own of GNMAs, FMACs and other such government agency debt, nor their holdings of corporate and soaring finance sector debt.
We are the world's largest DEBTOR NATION, and continue to rely on others to finance our consumptive spending binge, and we owe them back. But, how long will they continue to cover our consumptive ways? Suppose they stop financing us. What could we do? How would we pay for our imports then, or for our excessive federal spending?
Foreign interests now own more and more of America - - According to the above chart, they own about 44% of federal government treasury bonds. Foreigners own about "$9 trillion of U.S. financial assets, including 13% of all stocks, 13% of agencies, and 27% of corporate bonds", according to Gillespie Research/Federal Reserve. Consider this > Fannie Mae and Freddie Mac are the largest suppliers of mortgage funds in America, borrowing extensively on the open market - it has been reported two-thirds of their $1.5 trillion outstanding debt is held by foreign investors, up from one-third in 2002.
We should not be mad at foreign interests. We are the ones consuming beyond our own production, with nil savings, creating unprecedented debts in all sectors and trade deficits, PLUS excessive federal spending.
U.S. Federal Government Debt vs. Rest of World
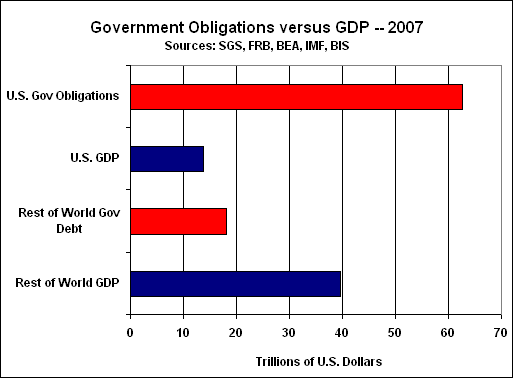 Here is another way of looking at U.S. federal government debt.
This chart takes the present value of all US Federal Government debt obligations, including unfunded social social and medicare obligations, which at end of 2007 total $62.6 Trillion (upper red bar on chart)
(data source > )http://fms.treas.gov/fr/07frusg/07frusg.pdf
- - and compares that $62.6 Trillion in debt to U.S. GDP and to Rest of World's Government Debt of about $18 trillion (and rest of world's GDP).
Restated > U.S. government debt of $62.6 trillion is 3 1/2 times larger than the sum of the debts ($18 trillion) of all governments in the world.
[NOTE > Our Debt Summary Table shows such debt at $119 trillion end of 2010.]
Yet, the U.S. economy (GDP) is 68% smaller than the rest of the world. (comparing the blue bars on this chart)
Dramatic, right?
This graphic comes from a shadowstat article (http://www.shadowstats.com/article/292), which states > "U.S. federal obligations are so huge versus the national GDP that the country’s finances look more like those of a banana republic than the world’s premiere financial power and home to the world’s primary reserve currency, the U.S. dollar."
You will find that $119 Trillion debt also in the debt summary table below at the bottom of this page (by there adding federal debt of $14 trillion plus the unfunded govt. debt categories there listed). That table is also at Debt Summary Table
Did all of this debt build-up help families, social security, education quality, or produce positive balances of trade?
This report points to the cause of federal debt as run-away consumptive social spending to ratios unprecedented in history. Social spending is consumptive spending, and should have been fully paid for - - not borrowed from future generations. But, since they built-up debt by $5.4 trillion then they should show us their debt reduction plan of $5.4 trillion. Right? Is such a plan in the budget? No!!. Why not?
CLEARLY, as said at the top of the report, government should not be allowed to borrow for consumptive spending programs. And especially, government should not be allowed to borrow pension trust funds intended for future retirees - - and consume it all today on other stuff.
Instead of truly reducing debt, we just hear talk about eliminating deficit spending. That is a camouflage operation. The Budget Deficit and Trust Fund Siphon Report (a must read report) shows: For years most political leaders bragged to the general public "we ran a large budget surpluses in the late 1990s." Also, they said they wanted to 'save social security'. Listening to such rhetoric some might think the federal government had cut general spending so as to produce surpluses, and thereby save social security. But, that's 'smoke & mirror' - since they did not tell you they siphoned-off billions from the trust funds to achieve that 'accounting gimmick', and spent it all on non-pension stuff - plus they ran up the debt another billions and billions each and every year. In 2002, for example, the general government siphoned-off $140 billion from the social security trust fund plus $62 billion out of the federal employees pension trust and federal hospital trust - a total of $203 billion - - every penny spent on non-pension things. Had we not consumed that $203 billion on non-pension spending the 2002 deficit would have been $203 billion higher than stated.
Before we can reduce the federal debt principal amount of $7 Trillion ($23,000 per each child and adult), we must first balance the general government's budget (and not by using trust fund surpluses) in a way that stops any future increase in debt - - You don't need to be a rocket scientist to know that.
There's much talk about a budget balance by soon. Will it happen? Don't count on it, as they are not counting ALL deficits. And even that 'budget' calls for all hard choices on cuts to be made AFTER the president leaves office - - when he's gone and no longer accountable. Further, it still counts incoming social security surpluses in the 'balance', although all surpluses are siphoned-off for non-pension programs with more IOUs placed in the 'kitty', which means the debt still rises. What kind of approach is that?
And, if a congressman calls for cuts to be made earlier he is shouted down, by 'socialization architects' yelling such will send little ladies to the streets from their wheel chairs, starving the aged on social security, denying children an education, etc. Then, all politicians run for cover and lay low. Brave and honest group. Proves lack of intent to face the music and make true hard choices. They know children cannot vote, but are un-afraid to stick them with the bill - - and at the same time on TV show a tear in their eyes as they say, 'save the children'.
We should demand ALL cuts be made equally per year over that period, plus no other use allowed of pension trust funds. In fact, to be safe, we should not think it will happen unless they plan to cut even more up front, as a safety valve in case future economic conditions are not what they hope for. We keep hearing how great the economy is. If they believe that, then why are they not proposing up-front cuts now - - instead of waiting for the next slow-down as a justification for doing nothing.
And, the budget should require that they not be allowed to siphon-off any Social Security or federal pension trust fund surplus flows for non-pension spending - - as they have so far done with over $800 Billion of same (covered in the Social Security Report ) - 40% of the siphon-out was done in past 4 years. In fact, the budget should call for additional cuts to enable them to repay that trust fund with non-government-owned IOUs that can cover seniors when the approaching surplus flows reversal, so that our kids don't have to pay extra taxes or take on their backs any more debt to cover that which has been siphoned-off. The way they plan it, they will continue to siphon the Social Security fund, because they like the 'free money' and it disguises the deficit, which means total debt will still rise.
"The current un-funded Social Security liability is $9 trillion - more than twice the official national debt. Even if the traditional deficit is eliminated in the year 2002, so that the traditional national debt is no longer increasing, the national debt in the form of the Social Security liability is likely to increase that year under current law by about $500 billion," Economist Martin Fieldstein said January 31, 1998.
All they have to do is prove to us they have a clean plan that shows the total debt falling below $20,000 per child as well as the un-funded social security liability, with a published plan to zero it out over time. We can understand 'plain things'. Where's the honest plan that includes all spending and debt creators?
| All they are doing is 'talking' about 'balancing' the budget. Where is the plan to pay down the national debt principal, and get that $20,000 off the backs of each of our kids?
Stop 'talking' about deficit and 'book-cooking' games, and give us a timetable to eliminate the debt principal amounts. I want to show it to my kids, so they know they are going to be free and clear of our past waste. |
BELOW IS A COPY OF THE Debt Summary Table web report
CONSUMER DEBT - HISTORIC
Although this report is intended to address government generated debt, here's a short item: "The consumer balance sheet is stretched. Payments on consumer debt (mortgage loans, credit cards, and car loans or leases) are at an all-time high, as a percentage of disposable income." Robert Rands, The Vanguard Group, Wellington Management, Jan. 1997.
Household debt has risen at rates 70% faster than growth of the economy since the late 1960s, when real median family incomes ceased historic growth. Such suggests real equity & savings are not the driving force of economic size - - it is all debt driven. (for a discussion and unique color graphic on household debt trends, see the section of the Family Income Report and the house-hold debt section of the National Debt Report).
This is further evidence of the historic squeeze on citizens trying to keep up with the unprecedented size of federal and state & local government spending, debt, total taxation and the share of the economy dependent on government spending, compared to prior generations. Living beyond ones means has become too often the norm, for which government practices set the example. (see links bottom this page to other related reports).
Not a pretty picture to pass on to our young families and their children.
How about a nice big debt reduction plan?
I didn't say 'deficit' reduction, I said DEBT REDUCTION - - reducing the $5.7 Trillion total debt.
How often have we heard some blame all our debt on the 1980s? Have heard that many times, right? Well, we know from the above charts this was incorrect, and must be attributed to evasive 'finger-pointing' as an excuse not to fix the problem. We know from the second chart (debt per child) that per capita debt started to rise in the mid-1960s - and thereafter the increase accelerated. We know from the 3rd chart (Debt % GDP) that in the late 1960s the falling debt ratio started to flatten out, and by 1974 it stopped falling. We know from the Government Spending Report (chart #3) that starting in the mid-1960s total government spending increased much, much faster than the economy's growth, much being financed by more debt and inflationary money creation. We know from the Inflation Report that starting in the mid-1960s rates of inflation jumped up, to accelerate upward thereafter until its rise was reversed in the early 1980s. We know from the charts that debt was added in 1981-88) (about $1.7 trillion, or 32% of our current total in that 8-year period), when Congress accelerated spending instead of cutting same - - although Congress approved a tax cut.(see the Reagan Era Report. We also know, from chart #1 above that $2.8 trillion of all federal government debt now on the books was created just in the1990s - - despite incoming revenue from the 2 largest tax increases in. The next 10 years followed with an additional $8 trillion. And, the Raiding the Trust Funds Report shows that more and more debt has been added in a 'hidden' manner, by siphoning-off incoming surpluses to the social security and federal employee pension funds, to spend on non-pension items without showing same in the deficit calculation.
And, while all this debt build-up was going on, the Family Income Report shows stagnant to falling real median family incomes for 2 ½ decades - despite more families needing 2-wage earners, compared to but one in prior periods. (even if one invokes a CPI adjustment , it will be shown that the last 2 ½ decades have had a miserable family income performance, compared to the period prior to 1970 when debt ratios were falling).
One thing is for sure, those who point fingers at the 1980s should be careful. But, what we really want them to do is not to point and blame, and then do nothing. We want them to find a way to at least return debt ratios to the 33% GDP ratio of 1974 (chart #3 above) - - which would mean cutting the current debt two-thirds- - a $9 trillion cut - - for starters. Have we heard any 'finger-pointers' proposing a plan to accomplish that. Nope.
The purpose of the above paragraphs is not to point fingers, but to gain some perspective. We need to go beyond myths, and to the facts - - so we can get on with a solution. It really does not matter which party was in power year X vs. year Y. We all must find a way out, together.
A FEDERAL DEBT ELIMINATION PLAN
While we 'hold our breath' for an international debt elimination plan (fueled by turning foreign trade balances from negative to positive), and for what if anything will be done about the estimated future Trillions in un-funded liabilities of social security & Medicare, and to identify government pension liabilities, and off-budget borrowing - - how about at least doing something with our $5.7 Trillion internal federal debt?
Prior to the 1960s, America's leaders basically followed a 'debt-free' practice, except in time of major war threats. Then, the tune was changed.
Instead of small talk about small things like a deficit of $100 billion (partially masked by spending pension trust funds on non-pension programs), how about talking about something 50 times larger: THE DEBT PRINCIPAL OF $5.6 Trillion ?
AND, how about a plan to eliminate that debt by the time my grandchildren finish grammar school & high school ??
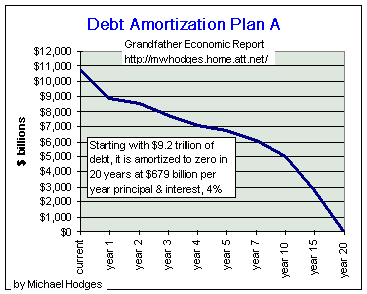 This chart shows a type of plan shows a concept to eliminate all debt by amortizing it to zero in 20 years. It requires a cut in spending. This, coupled with the current annual interest charge, provides the annual payments to meet this plan.[asset sales can accelerate the program].
Don't criticize. Present your own plan to zero-out this debt from our youth in less time, so they can start adulthood with a clean slate. If you want to see more details of this reduction plan, visit Action Targets & Plans Report.
If you are one of those who believes debt doesn't matter then please convince all our children and grandchildren that they will never have to pay any taxes to support debt or receive reduced retirement benefits (reducing their standard of living), or pay back interest and principal to foreigners to whom we owe. Then explain to them who is going to pay this if they don't.
Also explain to the kids that several generations ago America did not think there was going to be a World War II and, of course, you could tell them it will never happen again and convince them they don't need the same level of national security your generation had, just like those after WW I told their kids. Tell them the facts, not 'tooth fairy' stories.
DEBT REDUCTION AS MEANS TO REDUCED SPENDING AND REDUCED DEBT
Further, we have seen in the Government Size Report, and in the Federal Government Spending Report, that total government spending has grown 4 times faster than the economy's growth, and the federal government sector alone has grown 10 times faster than the economy. Nobel laureate Milton Freedman views about the effectiveness of government spending were that it is the high level of total government spending that is the problem. I, for another, concur with his 'its the high level of total (meaning federal + state/local) govt. spending that is the problem'. And, Freedman also says 'I am convinced in all my studies that governments will continue to spend all revenues they receive (plus some more), and am convinced the only solution to reducing spending is to reduce revenue (taxes).' What he's saying is you must put pressure on the available revenue side. And, as the Reagan era shows, by reducing taxes spending may not be reduced at first but such produces deficit pressures which in turn forces a spending slowdown (restraint), below what it would have been without said tax cut. (had Bush & Clinton, in the 1990s, not reversed that course via record tax increases, the Reagan action would have resulted in even more spending cuts over time than occurred). Taking this a step further, if we call for a reduction of debt principal, the same should happen as far as spending is concerned, as to meet an amortization of some type in a budget (and politicians should be required to have debt principal payments in each budget) other spending would have to be reduced. So, the Freedman approach holds for spending reductions, whether you reduce taxes or pay down debt principal. Therefore, if reduced spending is a goal, then all approaches to accomplish same are viable, taxes and/or debt principal reduction. Of course whenever one calls for tax cuts, then those for big government spending know tax cuts will force multi-year spending cuts, eventually - - and they use the defense to protect turf that all tax cuts are 'for the rich' to de-rail said efforts. From this, I conclude that those against reducing debt are in fact also in the camp of those for big government who are against reducing spending. But, debt reduction cannot be defended against by 'for the rich', and represents a vital strategy to spending reductions. Therefore, I am for debt reduction as a means to reduced total govt. spending as a share of our economy.
JUST ONE MORE CHART
 GOVERNMENT DEBT
OVER TWO CENTURIES
The 1971 data point = $75 million
The 2010 data point = $14 TRILLION
I am for debt reduction
as a means of realizing lower spending ratios,
AND lower debt,
as a beneficial bequeath to the next generation.
END OF DEBT REPORT
Where do you go now? 4 ideas:
Constructive input welcome
|
| Home & Contents | Summary | Feedback | What's New | Eye-opener | Must See | |
Copyright © 1997-2011 Michael W. Hodges. The Grandfather Economic Report series is the intellectual property of its author; all rights reserved under Copyright Conventions. Permission to redistribute all or part of this series for non commercial purposes is granted by the author, provided the associated web page address is included and full credit given to the Grandfather Economic Report and the author, Michael Hodges. Notice appreciated via email
Bottom of Grandfather Federal Government Debt Report, at: https://grandfather-economic-report.com/debt.htm