Substantial hidden costs imposed on the private sector |
By Michael Hodges - email |
Grandfather Economic Report series
| Home &
Contents | Summary | Feedback
| What's New | Eye-opener
| Must See |
Substantial hidden costs imposed on the private sector |
By Michael Hodges - email |
Government is costing us more than its reported spending,
and it's difficult to see the huge extra costs of complying with government
regulations.
The larger the share of the economy consumed by federal, state &
local government spending
the more the flow of regulations impacting the private sector with compliance costs.
Complying with government regulations consumes $2
Trillion
($1,590 billion federal mandates, $446 billion state & local government
mandates)
- 17.5% of the economy's national income -
- $6,610 per man, woman and child, or $26,436 per family of 4 -
- adding this regulation cost to $19,109 government
spending per person
equates to $25,719 per person of government impact -
AND - compliance costs small business more per employee than big business -
AND - this does not count compliance cost impacts of the Patriot Act, Sarbanes-Oxley or new healthcare regulations
- federal expenditures on regulatory activity increased 2.7 times faster than economic growth since 1960 - - at 14% per year compounded -
Federal, state & local overnment mandated regulatory compliance costs are huge amounts: as much as all spending by state & local governments (education, police, welfare, etc.), or twice as much as social security & Medicare spending, or 3 times more than national defense. And, government does not budget or account for these huge costs - although $100 hammers are accounted. Despite congressional mandates, government has been dragging its feet for years to account, measure & control - thereby placing the economics of our young generation at incalculable risk.
(The late Nobel Laureate Dr. Milton Friedman, in various
letters to this author, continually stressed the importance of studying this critical area
of regulatory compliance costs and the basic information used herein. How right he was!)
(Nobel Laureate Dr. Milton Friedman continually stressed the
importance of studying this critical area in various letters to the author. How right he
was!)
[This Regulation Cost report includes picture-charts that you have not seen, and is part of the series of Grandfather Economic Reports - of economic threats facing young families and their children, compared to prior generations
If a nation has a goal of continually increasing real income & economic living standards for its citizens, plus a strong currency and positive international trade balance, it must make sure the free-market private sector is by far the largest and fastest growing share of the national economy.
The relative share of the economy represented by the pure free-market private sector is determined by the share of the economy controlled by federal, state and local governments - which is determined by the sum of government spending plus all costs to the private sector for compliance with government-mandated regulations.
The larger the section of the economy that is consumed by government spending, and the higher the regulatory costs mandated, the smaller the effective share of the economic pie remaining to the 'free-market private' sector. (It is the intent of this report to review the costs and trend of regulations, not the possible benefits vs. liabilities of various regulations).
QUESTION: The purpose of this report is to learn what share of the economy is represented by mandated regulatory compliance costs. [See note at bottom of page regarding data]
HERE'S A SUMMARY OF FINDINGS (detail to follow)
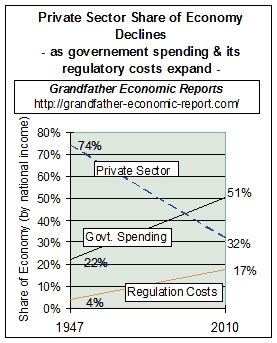 This chart looks at the economy (as measured by national income) in 1947
compared to today. Its easy to understand - - let me help. This chart looks at the economy (as measured by national income) in 1947
compared to today. Its easy to understand - - let me help. The declining (blue) line is the free-market Private Sector's share of the economy - -reduced from a 74% share of the economic pie in 1947 to a 32% share today. That's a HUGE reduction - - a transfer of 42% of the economy from the private sector to government spending and its mandated regulatory compliance costs. This was caused by two factors: 2. The Red Line on the chart: the share of the economy's national income consumed by regulatory compliance costs mandated by combined federal +state + local government entities also increased faster - - regulatory compliance costs growing from 4% of the economic pie to a 17.5% share (13.6% federal mandates and 3.8% state & local govt. mandates), the subject of this regulation cost report. The more of the economic pie consumed/controlled by government spending, the smaller the portion left for the free-market private sector. That sector's share is even smaller if we subtract the costs of complying with government regulations. That's what happened. Most agree the private sector (not the government sector) is the prime generator of long-term real median family incomes, living standards and freedom. This chart shows that the private sector has lost nearly half its share of the total economic pie, due to increases in government spending and regulation cost ratios. |
FOUR QUESTIONS:
"Efforts to restrain government will come to naught if new budgetary restraint is not accompanied by new regulatory discipline." The Economist, July 1996.
Now, let us look at a few pictures showing the size of regulatory costs in dollars, per capita and as a share of the economy.
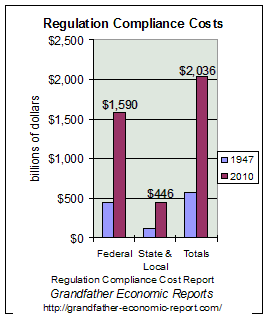 REGULATORY COMPLIANCE COSTS = $1.4 Trillion
Look at the left chart, concentrating first on the 2 bars on the right side.
These 2 bars represent the current combined (federal + state & local government mandated) regulatory compliance cost totals: $2,036 Trillion today vs. $564 Billion for 1947.
Of the $2 + trillion totals today, the federal mandated portion is $1.590 trillion (based on spending ratios per study by Dr. T. Hopkins*), and the state & local government mandated portion is estimated at an additional $446 billion. *acknowledgment to Dr. Hopkins bottom of page
Of the $2.036 trillion for federal mandated regulatory compliance costs, Hopkins' study breaks this down into 3 categories: 37.1% for Environmental & Risk Reduction (such as air emissions, water pollution, noise, hazardous materials, superfund, nuclear), 30.2% for Price & Entry Controls (labor market controls, product prices, marketing regulations, energy rates, financial, banking and insurance ), and 32.7% for Paperwork (taxpayer compliance, health-care regulations).
Tax Compliance costs > Based on above ratios, Federal paperwork regulations account for approx. $336 billion, of which the Tax Foundation estimates individuals, businesses and non-profits will spend an estimated 5.8 billion hours complying with the federal income tax code for 2002, costing $194 billion - - and heading toward $350 billion by 2007 - - an 80% increase. Of course this does not include tax compliance costs at the state & local government level.
From the above totals, it can be seen that just a 10% reduction in regulatory costs would equate to $2 Trillion freed-up spending impact to the private sector.
These costs placed by government on the private sector are on top of government spending outlays.
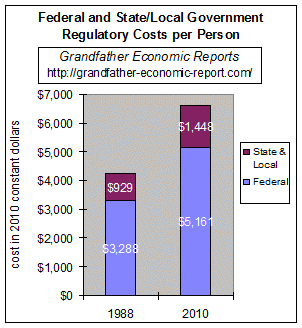 REGULATION COSTS PER PERSON - 21% faster than inflation
The left chart, shows the cost per person, with a bar for 1988 and for 2010. Each bar shows the estimated regulatory compliance cost per person, divided into federal vs. state & local government shares - - stated in inflation-adjusted 2010 dollars.
The 2010 bar shows the federal portion of $5,161 per capita, and the state & local portion of $1,448. Combined total: $6,609 per person - or $26,436 per family of 4.
The bar for 1988 shows the federal portion of $3,288 (in 2010 dollars) and state & local government at $929. Total: $4,217 (in 2010 dollars).
It can be seen that the regulatory compliance cost per person increased 57% faster than inflation. It has been reported that the federal part is a conservative figure, as it does not include costs of lost productivity resulting from imposed regulations.
ITEM: The Federal Government Spending Report shows that actual federal spending is $12,238 per person, and the State & Local Government Spending Report shows that its spending equates to $6.869 per person - - summing to total government spending per person of $19,107 shown in the Combined Government Spending Report.
If we add total government spending of $19,107 per person in 2010 to the above total regulatory compliance cost of $6,609 per person - - we have a total combined impact of $25,716 per person to cover both federal + state + local government spending and said government mandated regulation costs. [for chart on outlays data, see Grandfather Government Spending Report]. [author note: data, references, and calculation method available from link at bottom this page]
Real median family incomes (and the dollar) should be targeted to a long-term upward path - - after 2 ½ decades of stagnation & decline, per the Family Income Report. And, international trade & current accounts should be targeted toward balance - even to a surplus to liquidate soaring deficits. The private sector's relative size should be increased significantly above its 32% share of the economy (after accounting for government spending and regulatory compliance costs), by reducing both government spending and regulatory compliance costs as a share of the economy.
The problem is that government is used to increasing its share of the economy, both by its spending and by imposing regulatory compliance costs on its citizens. Even if government spending should hold at historically high current ratios, but continue to accelerate un-funded regulatory mandates to the productive private sector, then the effective government, non productive share of the economy will continue to increase at the expense of the private sector. It would be naïve to believe regulatory costs will decline per capita (and as a percent of the economy) as long as total government size and spending remain large. As an example, the State & Local Government Report shows such employees growing in numbers faster than the general population. (A rising quantity of government employees does not normally result in fewer regulations, of less detail - quite the contrary).
$5,500 per Employee Unfairly Burdens Small Firms more than Larger Firms |
| Additionally, it should be recognized that "the average small business firm with fewer than 20 employees appears to have spent some $5,500 per employee to comply with federal (not counting the states) regulations in 1992. In contrast, firms with 500 or more employees spent, on average, $3,000 per employee. Manufacturing firms employing 20-499 faced higher per employee costs than either smaller or larger manufacturers, and manufacturing firms of all sizes had higher costs per employee than firms in other sectors, ranging from $4,900 to $10,600." Regulatory Costs in Profile', page 19, Dr. T. Hopkins. |
ANOTHER VIEW - - FREE-MARKET PRIVATE SECTOR'S SHARE OF ECONOMY CUT TO 32%, FROM 74% by a combination of government spending plus regulatory compliance costs -
How might it look if we compared the private sector's share of our economy in 1947 to today? You have already viewed the pie charts for spending outlays shown at the top of the page and in the Private Sector Report referenced above. The following charts provide a graphical view for outlays PLUS regulatory costs that might be expected, showing the Free-market Private sector's share being reduced from 74% to 42% of the economy - 1947 to today.
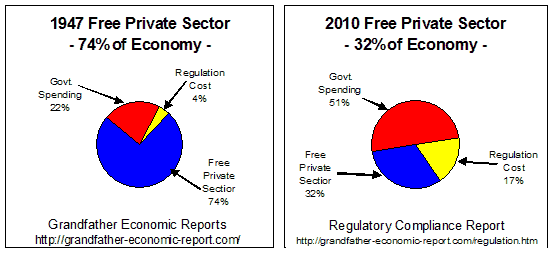 Take a look at this chart. Note the size of the blue (private sector) slice of the economic pie in the left
chart, compared to its share of the pie in the right chart.
The chart shows the blue private sector share 74% share of the economic pie (national income) in 1947 shrinking to a 22% share today, as both government spending outlays and regulatory compliance costs expanded faster than growth of the general economy.
This demonstrates graphically how federal & state/local government spending combines with government mandated regulatory compliance costs, to change the relative free-market, productive private sector share of the economy, over time.
And, to place that yellow wedge in perspective, regulatory compliance costs total a huge sum: nearly as much as all the spending by all state & local governments, or twice the size of combined social security and Medicare spending, or three times larger than defense.
(Exact data sources for regulatory costs are few, as Dr. Hopkins points out in his study. Data for as far back as 1947 is probably non-existent. But, we need to gain more understanding of how such forces as government spending and regulatory compliance costs change over time - - with respect to the size of the economy, and to the free productive private sector's relative share. This chart is an attempt to broaden that understanding - and an encouragement for others to perform more extensive studies. Estimates are based on the information & assumptions presented in this report - see link to data table for method (bottom this page). (More precise data is solicited)
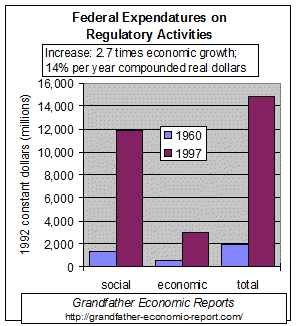 FEDERAL EXPENDITURES FOR REGULATIONS FEDERAL EXPENDITURES FOR REGULATIONS What do they spend to create and control this? One thing driving regulatory costs upward is the increased expenditures by government on such activity. The left chart shows that inflation-adjusted spending by federal agencies for regulation activities increased from $1.9 billion to $15 billion 1960-1997. That's an average compounded rate of increase of 14% per year. From 1960 to 1997, federal regulatory activity expenditures increased 38 times - - or 2.7 times faster than economic growth - since national income increased but14 times over that period. This is a dramatic increase. What about state & local governments? The above chart is for federal expenditures on regulatory activity. This author could not find any data on the increase in state & local govt. expenditures relating to federal mandates, or from their own generated activities. However, few should believe that state & local expenditures increased at slower rates than shown for federal expenditures - - most likely they increased at much faster rates, given the explosion of state & local government employees over this time period so much faster than general population growth, as shown in the State & Local Government Spending Report. The above spending data is from Regulatory Changes and Trends: An Analysis of the 1998 Budget of the U.S. Government by Christopher Douglass, Michael Orlando, and Melinda Warren - Policy Brief 182, August 1997 - the chart and its comparison to economic growth is by MW Hodges. Following is a chart from the above study. Note the early 1980s was the first interruption in the rapid up-swing of federal regulatory activity spending in 2 decades. In fact, during the 1980s, said spending declined in real terms - - only to resume its fast upward pace in the 1990s.
Note the early 1980s was the first interruption in the rapid up-swing of federal regulatory activity spending in 2 decades. In fact, during the 1980s, said spending declined in real terms - - only to resume its fast upward pace in the 1990s. Compliance costs small business more per employee than big business In 2004, according to a report released by the U.S. Small Business Administration's Office of Advocacy, small businesses spent $2,365 more per employee last year to comply with federal regulations than their larger counterparts. Companies employing fewer than 20 employees spent an average of $7,647 in 2004 complying with federal regulations on items ranging from tax and environmental compliance to international trade and workplace requirements. That's 45 percent more per employee than at companies with more than 500 workers. Arizona Republic Sept. 20, 2005 - http://www.azcentral.com/arizonarepublic/business/articles/0920regulation20.html COMPLYING WITH THE TAX CODE - lost productivity for everybody Additional to the above cost of tax returns, here's a perfect example of how government mandates REDUCE PRODUCTIVITY for nearly every citizen > the huge costs of complying with the tax code. Compliance costs in terms of time have skyrocketed from an average of 17 hours and 7 minutes fifteen years ago to 28 hours and 30 minutes today. Lost productivity is in the billions of hours. The cost in dollars is now about $200 billion. ref. S. Forbes for the National Taxpayers Union, 2005 DESPITE HUGE INCREASES IN FEDERAL SPENDING - - STILL NO CONTROL - - with more danger on the horizon for our young Despite all this huge rate of spending by federal agencies, the Office of Management and Budget (which is charged with developing regulatory compliance cost measurements, accounting and control), very little is happening as of December 1997 to rein in this monster. Various summaries of this unacceptable performance is contained in: November 1997 OMB's Regulatory Accounting Report Falls Short of the Mark by Dr. Thomas Hopkins, 2. Regulatory Process Reform From Ford to Clinton by Murray Weidenbaum, and 3. December 1997 What Next for the Nanny State? by Thomas J. DiLorenzo and James T. Bennett. The latter study raises many flags about the future, suggesting that the current tobacco settlement will, in time, lead to further regulatory assaults on myriad other industries. Once individual responsibility for consumption choices is denied, there are no limits to the regulatory state's reach in the name of "public health." Drs. DiLorenzo and Bennett write that in crusade after crusade, whether it be against tobacco, DDT, fatty foods, alcohol, or whatever product the self-appointed "national nannies" disapprove of, facts do not matter. Once a "target" has been chosen, all that matters is the "moral superiority" of their position. Facts that conflict with that position are either ignored or the motives of those who present such information are impugned. The latest attempt by Congress to get a handle on this. As Dr. Hopkins points out:
"The 1996 statute's charge to OMB called for four types of information: Congress continues to "try" without result, and the U.S. Senate continues to pass more mandates to get to the bottom of this, by adopting S. 1023 in July 1997 containing language similar to the 1996 requirement. What good is Congress if it can not compel bureaucracy to respond? There is much evidence that Congress should mandate a stoppage of all new regulations of any kind, until the bureaucracy has fully complied with congressional mandates - - recognizing that there are many special interests which have an interest in delays and stonewalling of accountability in this huge cost area - including but not limited to trial lawyers. |
QUESTIONS
In the face of increased pressures on government spending and taxation, what actions are required to prevent un-funded regulatory compliance mandates from continuing - - or even escalating - - as a 'hidden' way to cover political promises?
CHALLENGES FACING COST DETERMINATION
by Dr. Thomas Hopkins
"Challenges facing research into regulatory costs are substantial, but the scale and scope of such costs are sufficient to justify increasing the priority accorded them by policy makers and researchers. Better data are needed on the incidence of regulatory costs, and that data should be used more extensively in tiering regulatory requirements to avoid undue burdens on small business, particularly in the relatively neglected paperwork regulation area."
"Not withstanding the substantial burdens created by regulation, no comprehensive system exists for a regular, annual accounting of such costs. Thus, the decidedly primitive allocation assumptions underlying this work represents, regrettably, the state of the art. Given the substantial magnitudes involved, there seems little excuse for the "hands-off" approach taken by government statisticians and accountants. Simply because a cost does not correspond to a tax collection should not spare the government from a responsibility to document the costs it is imposing. The estimates and projections should not be interpreted as a claim to new and precisely correct figures. Rather, they should be seen as a challenge to the regulatory status quo."
Dr. Hopkins, in "Regulatory Costs in Profile" [see box below titled "Acknowledgment"]
Author's NOTE:
[the author wants this report to be as accurate as possible - please email corrections, omissions and suggestions to MWHodges ]
DR. M. WEIDENBAUM ON PRIORITY FOR DE-REGULATION |
Author's NOTE: This Grandfather Regulation Cost Report was prepared to pass on information collected on the subject, and to ask some hard questions - - with the hope more will focus on this important area of our economy - - keeping in mind the impact on family incomes and trade balances for our next generation. While certain regulations may be beneficial to our society, each should stand the test of proper cost accounting & audit control - with sunset re-authorization. This report is another of many for a call to action on these matters. The numbers are huge - they must not be ignored !! |
ACKNOWLEDGMENT |
| To Dr. Thomas Hopkins (an
adjunct fellow of the Center for the Study of American Business at Washington University
in St. Louis and the Arthur J. Gosnell Professor of Economics at Rochester Institute of
Technology) for his excellent 'Regulations in Profile', Policy Study # 132, August 1996. [The author commends Dr. Hopkins for his good study, which forms the basis for the federal cost component of this report. Any errors in this report should be blamed on (and reported to) the author, not on the fine work done by Dr. Hopkins]. |
| Note - this Regulation Cost Report, a chapter of the Grandfather Economic Report series, is based on government reported spending, inflation and population data contained in appendix tables of annual 'Economic Reports of the President Transmitted to the Congress' published each February - and regulatory spending data from two learned studies referenced on page 3 of this report. While government spending and population data is readily available the same cannot be said for regulatory compliance costs which are not accounted by any levels of government, such depending on private studies which are few and far between. This report utilizes several learned studies, and is intended to add information to this subject of regulatory compliance costs. This report, first issued in 2002 and updated in 2005, assumes similar compliance cost ratios to federal spending as contained in the original issues and references to be similarly applied to recent published government spending, inflation and population data to arrive at such estimated compliance costs for 2010, since subsequent to the first issue no other such studies have been located. Readers are encouraged to do their own research on this subject, and also to notify this author [via email] of any found more recent learned studies considered relevant and reliable in addition to here contained, May more effort be made to account for and control these huge costs, just as so emphazised by the late Nobel Laureate Dr. Milton Friedman in his communications with this author. |
Link to 2nd page of the Regulation
Report
FOR Economist article, DATA SOURCE and Other
Reports
(click above link to important references, an excellent
article from The Economist, and the author's data tables.)
Or first, you can have a few laughs with Noah's Ark - about government regulations if Noah tried to build the ark today - - funny reality.
GRANDFATHER ECONOMIC REPORTS - HOME PAGE - a listing of the series of reports documenting economic threats facing young families and their children, compared to prior generations.
| Home & Contents | Summary | Feedback | What's New | Eye-opener | Must See |
Copyright © 1997-2011 Michael W. Hodges. The Grandfather Economic Report series is the intellectual property of its author; all rights reserved under Copyright Conventions. Permission to redistribute all or part of this series for non commercial purposes is granted by the author, provided the associated web page address is included and full credit given to the Grandfather Economic Report and the author, Michael Hodges. Notice appreciated via email.