| Home & Contents | Summary | Feedback | What's New | Link Index | Eye-opener | Must See |
Grandfather Economic Report series
| E-Mail | Send a link |
|
Action Plan Report A PLAN TO MEET 'BITE THE BULLET TARGETS' |

(This report is a part of the series of the Grandfather Economic Reports, revealing certain negative economic conditions facing families and their children, compared to prior generations.)
PLANNING OBJECTIVE:
OUR TARGETS (from the prior page on Targets) CALL FOR REDUCING FEDERAL SPENDING FROM 32% OF THE EC0NOMY TO 12%, AND REDUCING STATE & LOCAL GOVERNMENT SPENDING FROM 18% OF THE ECONOMY TO 8%. THIS WILL BRING COMBINED SPENDING DOWN TO 20% OF THE ECONOMIC PIE, RETURNING THE REMAINING 80% TO THE PRIVATE SECTOR. And, targets call for an elimination of the national debt via an amortization plan.
In this plan we will develop a format for the federal government only. A similar plan can be used for state & local government spending nation-wide, with a build down to individual states.
|
THE PLAN TO MEET THE TARGETS |
| This chart includes one 'bite-the-bullet' plan that most citizens can understand without becoming overly complicated. It brings spending in line in 4 years and eliminates all debt by the time my grandchildren graduate from college - - about 20 years from now.
Our target was for total government to be reduced from today's 45% of national income to 20% of national income - - Economist Milton Friedman indicated a more appropriate target would be closer to 12% for total government, equating to federal spending target of about 5% percent national income and state & local government 7% - - for a total of 12% of national income, instead of the 20% selected here.
The top black line represents total federal spending when it was 27% of national income (now at a 32% ratio) - - being reduced to our target of 12% of national income within 21 years This is accomplished in this graphic for the federal government by reducing non-debt service spending to its target within 7 years The left chart shows the results in total federal outlays (black line for debt service + other spending) as a percentage of the total economy. Note the top line moves from the current position of 27% share of the economic pie to 12% at the end of year 20. The red line is the non-debt outlays only, which reach 12% of the economy in a little over 7 years. RESULT: the non-debt portion of the federal government reaches its 12% target within approximately 6 years; and once the debt is fully amortized then the total federal outlays reach the 12% target within an additional 13 years. |
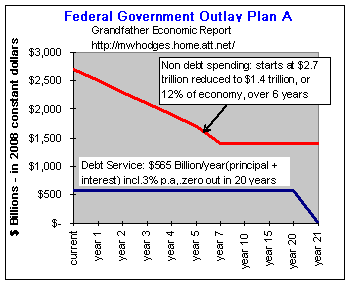
 This chart repeats the above chart, except this one is in dollars related to 2007 (for 2010 the red line would start at $3.9 trillion, up dramatically) This chart repeats the above chart, except this one is in dollars related to 2007 (for 2010 the red line would start at $3.9 trillion, up dramatically)
With this graphic we intend to show the same principal of spending reduction as previously depicted for 2007. This chart starts with the 2007 situation assuming a $3.1 trillion budget divided in but two components: 1. Debt service (black line) (now about $330 billion interest only) on a $11 Trillion debt balance - - is amortized at $565 billion/year (principal and interest) for 20 years, ending with zero debt and therefore zero debt payments of interest or principal. 2. The balance of the budget, here called 'non-debt spending' (red line), starting at approx. $2.7 trillion and ending at $1.4 trillion. 3. The Sum of these two lines start at $3.3 trillion total federal spending including interest, which by year 21 is reduced to $1.35 trillion (in 2008 dollars) with no debt or interest, a 56% reduction in 2008 dollars. For this graphic we are using constant 2008 dollars from year 1 to year 21. (tax revenues are ignored, as it is spending as a percent of the economy that is the problem; annual inflation adjustments can be added later to adjust the dollar levels in this graphic - - although the chart above, as a percent of the economy, will not change) |
If the Congress has been effective in lobbying state & local governments to also bring their spending in line with their historic targets, then the total government spending can be returned to 20% of national income level. The private sector has also returned to its proper 80% share, and we are back to a true free-market economy. Since the budget deficit is eliminated in the 2nd year, tax reductions may be phased by slight revisions to the amortization period, which could also be shortened. Asset sales should be planned to further shorten this time-span.
|
DEBT PLAN RESULT: |
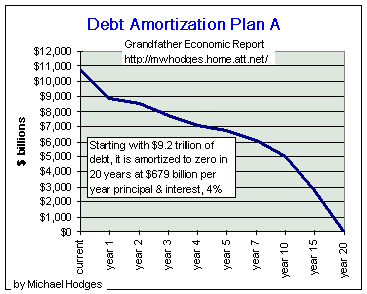
 The left chart shows the impact on the debt principal balance, being reduced from the $11 Trillion level several years ago (now at $14 trillion) to zero within 20 years - - about the time my grandchildren will be finishing college and ready to enter the workforce. (for the level debt today, and the historic trends, see the Debt Report.) The left chart shows the impact on the debt principal balance, being reduced from the $11 Trillion level several years ago (now at $14 trillion) to zero within 20 years - - about the time my grandchildren will be finishing college and ready to enter the workforce. (for the level debt today, and the historic trends, see the Debt Report.)
RESULT: our target of zero debt balance within 20 years has been met. (but, you will note this is based on a starting point of $11 trillion in debt, and to reflect 2010 debt we would have to adjust the starting point up to $14 trillion, requiring a steeper slope to reach zero in 20 years. It is recognized the above debt payment plan of $565 billion per year over 20 years requires $13.3 trillion in total payments, of which $2.6 trillion is interest only (at 3% rate). Even this $2.6 trillion in interest represents $9 per child (per capita). To reduce this interest charge and reach zero debt at an earlier time, certain government asset sales should be considered in the earlier years. Certain assets retained may mean less to the freedom and standard of living of my grandchildren than selling same to reduce the debt load at a faster pace. Certainly the assets represented by closed military bases could be auctioned with proceeds applied 100% to the debt, instead of just transferring these properties to other government agencies which need more spending to maintain as parks, etc. We have debts to pay off to remove said burden from the backs of our youth, and asset sales should be pursued in this regard. |
SUPPOSE THERE IS A BUDGET SURPLUS - WHAT TO DO WITH IT?
A full discussion on this topic, and the dangers to be avoided with recognition of history, is contained in a section of the Tax Report.
STATE & LOCAL GOVERNMENT TARGETS AND ACTION PLANS
Citizens should lobby state and local governments to eliminate their debt loads and downsize their spending ratios relative to the size of the economy to return to ratios of prior years. And, the federal government should perform various state by state historical evaluations as we have done here, establishing indicated targets and action plans similar to this format, the results of which would be published and sent to the states for their own refinement actions. By witnessing federal actions of financial responsibility, citizens will pressure state & local governments to meet theirs, too. The State & Local Government Spending Report shows the history of growing faster than the economy. Additionally, the number of their employees continues to expand faster than the general population; had their headcount growth been kept constant with population growth today there would be 18 million fewer state & local government employees. The target for state & local government spending was a reduction from today's 18% of national income to an 8% share, and to cut back their head-counts where there are closer to 2 employees per 100 citizens instead of today's 6 per 100 which is 3 times as many. See the State & Local Government Report.
FAMILY AND INDIVIDUAL BALANCES
It is quite possible that individual saving and balance sheet improvements will occur once the general public recognizes that there has been a significant change in government psychology: from one of 'consume now, and let the next generation pay later' to one that champions debt elimination, development of priorities, living within one's means and saving for the future. That will be a powerful lesson in responsibility as everyone experiences the restoration of the Private Sector to its proper ratio. .
|
WARNING |
| Increases in regulatory compliance costs mandated on this expanded private sector must be guarded against, as such temptation will be politically great while reducing the government sector share of the economy, and eliminating its debt. A strict cost accounting and audit system should be established to regulate the impact of regulators and their regulations - - including sunset deadlines with justification for renewal legislation.
ACTION IDEAS To assist with the necessary spending reductions required above, consideration should be given to: elimination of COLA's for all beneficiaries of government spending (social security, federal and state & local government employee compensation and pensions, welfare recipients), passing on to government employees and seniors all increases in health insurance, Medicare. Such approaches would not only assist spending reductions, but would result in more fairness & equity to private sector families who do not have legal cost of living, health insurance and pension plans guaranteed by government. Privatizing the biggie 'entitlement' programs: social security and public education, since these are the main programs of failure and the largest spenders. Also see Privatization report for state & local governments. Privatizing all other programs not intended by our nation's founders for government functions (see summary report). Assure that federal, state & local government employees do not receive better compensation programs than the median compensation available to private sector workers in their areas. Selling surplus assets such as military bases and some government buildings, and public lands now leased for grazing, logging, mining, etc. to raise capital - - should also be studied. No Stone Should Be Left Unturned !! |
|
BOTTOM LINE Just contemplate the national & international economic strength and increased security reserve of the next generation when the private sector share of their total economy is 38% larger than today - with zero debt. My children and grandchildren would like that. And, my generation might become more proud of our legacy to them. |
SUGGESTION: expand your knowledge, and that of others who count |
|
WHERE DO YOU GO FROM HERE ?? - 2 CHOICES:
1. Return to Planning Targets Page
or - 2. Return to HOME PAGE Grandfather Economic Reports
[ NOTE: recommendations for the Grandfather Education Report are contained in Education Recommendations ]
Copyright © 1997-2011 Michael W. Hodges. The Grandfather Economic Report series is the intellectual property of its author; all rights reserved under Copyright Conventions. Permission to redistribute all or part of this series for non commercial purposes is granted by the author, provided the associated web page address is included and full credit given to the Grandfather Economic Report and the author, Michael Hodges. Notice appreciated via email.
| Home & Contents | Summary | Feedback | What's New | Link Index | Eye-opener | Must See |