Grandfather Economic Report series
| Home &
Contents | Summary | Feedback
| What's New | Link Index
| Eye-opener | Must See
|
I am concerned about the economic future of our youth
| This is a mini-report about the increasing
dependence on international trade and our poor performance, presented in an
easy-to-understand format with pictures. |
| This report is a chapter of the Grandfather Economic Reports series, of
certain negative economic conditions facing families and their children compared to prior
generations. |
 Quick Links: Questions & Items - - Trade Dependence - - Goods Imports - - Trade
Balance annually - - Trade Balance cumulative - - Deficit
with China - - Current Account - - Govt. Debt to
Foreigners - - International Reserves - - Net
Asset Trend - - Global Trade Ratio - - Manufacturing
and other reasons - - Why Deficits Matter?- - Uncharted Dangerous Territory - - Trade Deficit by
Nation - - Major foreign holders Treasury debt - - Aging Population - - Hi tech and National Security
- - Energy threat - - What to Do
First, a repeat of several opening items on this Trade Report's
summary page - - to allow them to sink-in, and then to 16 dramatic tell-all pictures.
QUESTIONS:
Do our children & grandchildren deserve to be placed in a reduced
international position, with less independence from foreign interests, than we inherited
from our parents and grandparents? Would that make us proud? Are their future living
standards and national security threatened by an economy that is more dependent on
domestic and foreign debt, and on consuming more than we produce, with less foreign
reserves backing up each citizen than other nations?
ITEMS:
- Since 1952 the international reserve position of the U.S. has fallen from 50% of the
world's total to a 2.4% ratio - - a 95% drop. The
decline continues.
- Many other productive nations now have up to 23 times more
foreign reserves backing up each of their children than we have backing ours, and their
lead is increasing as the U.S. continues with massive trade deficits and record high
internal private sector debt ratios, with nil savings.With 5% of the world's population,
America consumes over 20% of world imports.
- The U.S. is the world's largest debtor, a long fall from being the world's
largest creditor when I was a young worker.
- For the past 30 years the U.S. has been unable to adequately compete internationally to
balance its trade with the rest of the world by at least exporting sufficient goods to
balance imports. Massive deficits soar. Even the information technology sector is in
deficit, and for the first time food imports exceeded exports.
- The U.S. economy is less independent than prior generations yet one quarter of
the economy depends on international trade in goods, 3 times more than before -
and foreign entities own more and more of our assets than we do theirs - while our education quality suffers relative to others.
- Meanwhile, the U.S. manufacturing base has declined 60%, leaving the
economy significantly less able to compete abroad in goods.
- And the U.S. has become more dependent on imported foreign oil and natural gas than ever
before, as graphically shown in the Energy Report. The oil
consumption-production gap is a whopping 71%, as consumption soars and production and
reserves continually decline. The U.S. is more dependent on energy produced by others than
ever before - - but not exporting sufficient goods to pay for it. At the time of World War
II the US produced all the oil it needed, even exporting to others. No longer.
- For most of the 20th century the U.S. 'wrote' most of the rules for world trade. No
longer ! ! For a long time the U.S. dollar was unchallenged as the world's reserve
currency. No Longer !
- Year 2010trade performance produced an $647 billion merchandise trade deficit, 28%
above last yar and one of the largest negative trade balance in history - despite
devaluation of the dollar..
- Cumulative trade deficits since 1985 total $8.9 Trillion.
- And, these trade deficits are owed to non-Americans - - not to ourselves.
- Our annual international trade deficit is larger than Social Security spending, 1.5
times larger than all defense spending, and 3 times larger than Medicare. This
International Trade Report, together with the chapter called America's
Total Debt Report, proves we are living beyond our means.
- In 2008 the U.S. had a total merchandise trade deficit
of $647 billion, while Japan & Germany produced a cumulative
trade surplus of $286 billion ($83+$203). That's
a whopping $1 trillion worse relative trade performance for the U.S., in
JUST ONE YEAR. This vividly shows how America is living beyond its means - - by consuming
more goods made by others than it produces to meet the needs of foreigners - - resulting
in exploding debts in favor of foreigners. And, these are not oil-related deficits, since
Japan and Germany have a higher oil import ratio than the U.S. U.S. trade deficits go on,
and on - - to the benefit of foreign entities because the American economy 'refuses' to
produce enough of its needs.
For decades Americans have enjoyed the game of consuming more than we produce,
borrowing from the future to make-up the shortfall with unprecedented ratios of domestic
and foreign debt increasing much faster than national income. These are dramatic facts,
with significant long-term implications for the currency, international economic power,
relative standard of living, and possible national security
of our nation's children into the future.
NOW - - let's look at some tell-all data charts
TRADE DEPENDENCE OF US ECONOMY
- - up, up and away !!
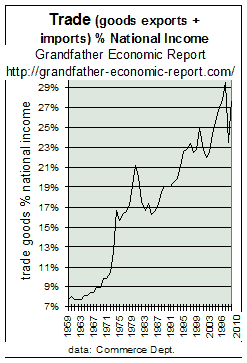
28% of our economy depends on foreign trade
4 times higher than before - - with trend straight-up !!
 When
we speak of competing in a global economy, When
we speak of competing in a global economy,
this chart shows how much more dependent are we on foreign trade,
than ever before. In fact, nearly 4 times more dependent on others.The
left chart shows the trend of the sum of imports & exports of goods (excl.
military), as a share of our economy (national income measure). [services
trade is a minor number and is left out of this plot and military transactions distort the
data]. Combined trade in 2010 was $3.2 trillion ($1.3 trillion exports, $1.9
trillion imports).
This chart shows combined exports + imports zoomed from 8% of the economy in the 1960s,
to 28% of net national income in 2010. Note the upward zoom is nearly straight up, meaning
U.S. foreign dependence is accelerating.
With more trade dependence one should next ask > Are we paying our way? Answer: -
NO !! We are going deeper into debt.
As America's economy depends more on trade it is more and more at the mercy of others
than prior generations - - which implies serious economic and national security issues
looking forward.
The next chart breaks down the above chart into its import and export components. |
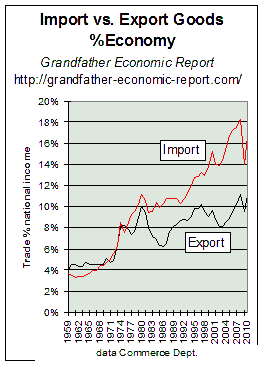 Notice imports (red curve) of goods - - zooming
higher, as a share of our economy,
from 3% to 17% of the economy (as measured by national income),
and, therefore, our economy depends on imports produced by others 6 times more than
before - - and still pointing straight up. 2010 goods imports totaled $1.94 trillion. Note
rising import ratio in 2004-10 despite major decline of the U.S. dollar's exchange rate.
(America, with less than 5% of the world's population, consumed nearly 20% of world
imports in 2000, according to Morgan Stanley Economist Joe Quinlan - - meaning much of the
rest of the world over-depends on America's debt-driven over-consumption of goods produced
by others).
Now look at exports (black curve) of goods. After rising 2.5 times faster
than national income in the 22 years prior to 1980, proving America's competitiveness, the
export ratio came to a screeching halt - - now oscillating 10% of nat. income. 2010
goods exports totaled $1.29 trillion.
U.S. exports have not had an upward impact on our economy's national income for 30
years, proving U.S.-produced goods are less competitive and less of interest to
foreigners than before - - and/or we are too busy consuming to produce. A comparison > high
cost Germany's export ratio of 35% of GDP is many times higher than America's
ratio.
Notice the widening gap between the two curves - - that's the exploding trade
deficit, as we import faster and faster than exporting to others. Prior to the 1970s
there was a net balance in our favor (exports higher than imports), but not any longer.
NOTE: Exports lagged imports despite the reduction in the international value of
the dollar between the 1970s and mid 1990s (and 2001-2004) which reduced our wages
relative to others. So, a weaker dollar does not guarantee a trade surplus - -
perhaps the opposite, as imports become more expensive. This suggests that if the
U.S. dollar should fall in its international value the U.S. will not become more
competitive - - which further suggests the reason is both our declining manufacturing base
(chart below) as well as the fact we do not produce (or
want to produce) enough goods to meet our needs, let alone produce sufficient goods
desired by others.
This is clear evidence that we are competing less well than before, and trends
are in the wrong direction by far. Perhaps Americans are too interested in consumption and
piling up debt and in speculation, instead of production and savings - - too interested in
financial paper instead of producing goods. This chart shows exports at about 11% of the
US economy. This compares to exports being about one-third of the Euro-region's economy,
indicative of that region's relative manufacturing base strength compared to the US.
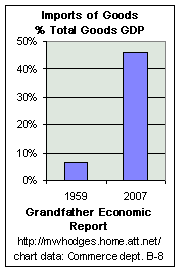 BECAUSE AMERICA
PRODUCES LESS and LESS of Needed GOODS,
the PENETRATION of IMPORTS INCREASED 7x to make-up the short-fall as America becomes less
and less self-sufficient.
The left chart looks at imports of goods, as a percentage of total goods
in our GDP. America's Gross Domestic Product (GDP) is made up of 3 components: goods,
services and structures. Here we look at the goods portion of GDP, and the percentage of
same represented by imports.
1. In 2007, goods imports represented 46% of all the goods used in the U.S. (up from 29%
10 years ago)
2. That's 7 times higher than the 6% import ratio in 1959.
This means > > whereas in 1959 the U.S. produced 94% of the goods it needed (just
6% were imported),
TODAY we produce just 54% of our needs for goods (importing 46%). This chart demonstrates
that import penetration increased - - dramatically.
data note: in 2007, total GDP was $13.8 trillion. Of this, its goods portion was
$4.1 trillion, or 31% of total GDP. The non-goods portion of GDP was 69% of total GDP (58%
for services, balance for structures). In that year, goods imports were $1.9 trillion, or
46% of total GDP goods - - as shown in the chart. - source: Dept. of Commerce (BEA), table
B-8, etc. of the 2007 Economic report of President.
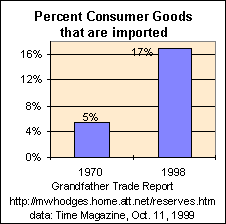 Consumer
goods are more and more fueled by imports, not local production.
Imports make up 17% of all consumer goods bought in the US, or $407 billion in
1998, up from only 5.4%, or $19.2 billion, in 1970.
Since the above chart shows imports soaring after 1998 we can assume the consumer goods
ratio is now higher.
In any case, this chart shows we are more than 3 times more import-dependent for
consumer goods than before.
This shows much of U.S. imports are not for investment purposes to help earn national
income into the future, but for consumption purposes which are gone forever. (data source: Time Magazine, 11 Oct. 1999, page 54)
Because of this U.S. global dependence on the production of others, not only is this
generation less independent than before but our dependence is so great and growing
so rapidly that we must more than ever start producing the best quality high school
education in the world, instead of lower education quality than prior generations relative
to foreign nations -
(as shown > International Education Report
and the International Math & Science Report)
- which place our younger generation at greater risk than ever before. Further, we must
assure private sector regulatory compliance costs to meet mandated federal and state &
local government regulations are less than our major competitors instead of increasing
(see the Regulation Report and its trend graphics).
"TWO-THIRDS OF AMERICANS ARE NOT PREPARED FOR THE GLOBAL
ECONOMY."
"Like it or not, there are a billion talented workers coming on board
the global economy who will do the most sophisticated software jobs amidst lousy
environmental conditions in Indonesia, India or China. That's a reality we have to deal
with. I hope we can keep our social safety net largely intact and still compete with a
billion new workers. But I've got to tell you. I find myself intellectually on the side of
the prime minister of Malaysia when he says 'you've had yours. Now it's our turn to have
ours.'
Their view is: 'If we choose to have a slightly dirtier environment while we grow
better jobs that's our choice and it's none of your business. The G-7 will go to Halifax
and pretend that they're in charge of something because that's what we pay them to do.
They ain't. And they are less in charge than they have ever been. I find myself
inalterably opposed to anybody who stands before this group and says government can have
much control over the global economy." Tom Peters, writer and
international business consultant, and advisor to former V.P. Gore
INTERNATIONAL
TRADE - NEGATIVE TRENDS LOOMING LARGER
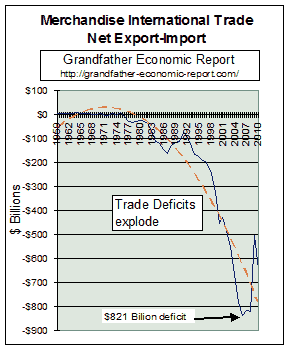 This chart measures the U.S. merchandise (goods, excluding
military) trade balance since 1959. Up until the mid 1970s a positive balance of trade was
realized, which demonstrated a past ability to remain sufficiently competitive in goods to
cover our import needs, no matter what they were. This chart measures the U.S. merchandise (goods, excluding
military) trade balance since 1959. Up until the mid 1970s a positive balance of trade was
realized, which demonstrated a past ability to remain sufficiently competitive in goods to
cover our import needs, no matter what they were.
NOTE: The U.S. is setting record negative trade balances each year since 1992 - -
recently exploding.
About mid 1970 trends turned against the U.S. as imports grew faster than exports.
This is same period when median family incomes stopped
growing, and more women left the home to produce another income. Devaluation of the
dollar followed. (see the Exchange Report with charts on
long-term trends of the dollar)
It can be seen that the pattern since the mid 1970's brings into focus the basic
question above - - America's lack of competitiveness world-wide. The chart shows
the year 2008 recorded near record of $821 billion deficit - a new all-time record
- and $265 billion worse than 2003. The slower economy in 2009-2010 caused imports to
decline a bit, causing the above blip. |
 USA
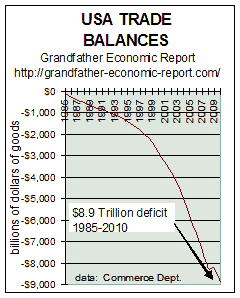
CUMULATIVE TRADE DEFICITS - - past 21 years USA
CUMULATIVE TRADE DEFICITS - - past 21 years The chart above showed the USA
merchandise trade deficit for each year -
- reaching $647 billion in 2010.
The left chart shows the USA cumulative merchandise trade deficit
- - with all nations since 1985. (cumulative means adding all deficits)
This cumulative total deficit since 1985 reached $8.9 Trillion by 2010 year end.
AND - that's a huge transfer of U.S. wealth ownership. |
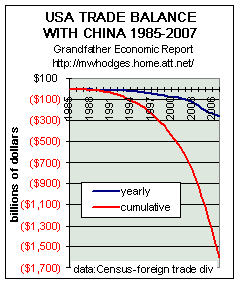 Next is a comparative chart of USA deficits with
one nation, China, which, in 2000 surpassed Japan as
the number-1 source of U.S. trade deficits. Next is a comparative chart of USA deficits with
one nation, China, which, in 2000 surpassed Japan as
the number-1 source of U.S. trade deficits.
The left chart plots the USA merchandise trade deficit with China from 1985 to present.
The black line represents the USA annual deficit with China, which reached $256
billion in 2007 - - 149% worse than 2002 and accounting for 31% of the total USA
merchandise trade deficit.
The red line is the cumulative (sum) of trade deficits with China
since 1985 - - reaching a huge cumulative total of $1.6 Trillion
up to 2007.
Many ponder the strategic implications of soaring USA trade deficits with China
in recent years, since China is thereby receiving dollars to help build its economic
power, while also expanding and modernizing its military forces. Additionally, as reported
in the Energy Report, China is now a major oil importer competing
with the U.S. for diminished world oil reserves. Meanwhile, China's foreign exchange
reserves increased to $1.04 trillion in 2006 (15 times more than the mere $69 billion of
U.S. reserves) and were up 250% from $292 billion in 2002. This China chart
prepared with Census Bureau data from link # 9, international section of the links page). |
Whenever there is a month that our exports rise, how often we hear politicians bragging
about how many more jobs that created on 'their watch'. But, they purposefully do not
tell you the whole story, which for that month would have meant a net job loss - -
because imports increased faster than exports. Job creation must be considered in net of
exports vs. imports, and without devaluing the currency paid our workers - - and
with regard to longer term trends. The negatives in the above chart indicate we are
continually running a net job LOSS.
"Even the supposed robust information technology
sector is running a $2 Billion a month net trade deficit; exports are rising,
but imports are up even more strongly due to computer components and a significant number
of finished products from overseas," said Richard O'Brien, Hewlett-Packard corporate
economist, in the National Assoc. of Business Economists News, November 1996. (author
note- by 1999 this technology deficit climbed 2.5 times).
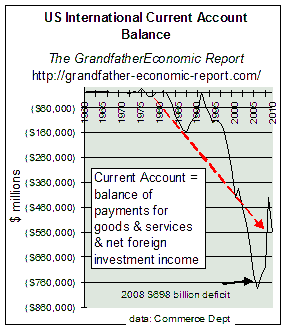 $8.4 TRILLION
INTERNATIONAL DEBT BUILD-UP in CURRENT ACCOUNT - including $698 billion in 2008 alone
The previous chart shows trends of our balance of payment deficits in merchandise
(goods) trade. The left chart gives the complete picture. It sums all components of goods,
services, investment flows, etc. Nothing is left out. Its called the Current Account
Balance.
As we purchase more from foreign nations than they from us, and as their investment
income from the US grows faster on what they own here than ours invested in their nations,
we owe them the difference - - and this chart shows we are in record deep negative
territory.
This chart shows in 200 the USA current account debt to foreign interests increased
another $698 billion, near another new all-time record, which also means an added $2,3102
in foreign claims on the future national income of each man, woman and child.
The left chart shows 48 years of yearly current account trends, with negative trends
against the U.S. over the past 20 years - - and plummeted in the 1990s and early
2000s.
In 1997 the U.S. current account had a deficit of $128 billion, which was the same
amount spent on our total Medicare program.
In 2010 the current account deficit was $561 billion ($2 billion red ink per day), 6
times greater than 1997 and > 2.6 times larger than our Medicare program and about the
amount paid for all military programs, and 26% more than the $586 billion cost of Social
Security.
The situation is potentially more serious than ever before. America is also
running an increasing deficit in investment income which will cause America's current
account deficit to widen indefinitely even if a weaker dollar stabilizes the trade
deficit. Charts below show the deteriorating U.S. net investment status.
Will such performance increase or decrease 'protectionism' in the U.S.? Would such
sooner or later seriously weaken the U.S. dollar and perhaps soon negatively impact its
reserve status vs. the Yen and Euro - -while re-establishing the historic path of the
long-term downward trend of the international value of the dollar per the chart in the Exchange Rate Report?
CUMULATIVE CURRENT ACCOUNT DEFICITS
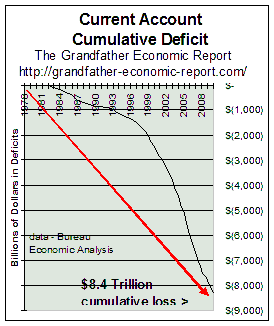 The left chart is a plot of the cumulative
current account deficits- - meaning the sum of annual deficits since 1974.
This cumulative deficit was $8.4 Trillion in 2010 - - which
is $27,815 per man, woman and child in America.
This means foreign interest have picked-up U.S. assets and mortgages on assets totaling
$8.4 trillion.
Stated more simply - - our children owe foreigners $8.4 trillion which we citizens
consumed in the last 20+ years in excess to that which we produced ourselves.
The current account deficit represents money the U.S. has to borrow from overseas to
finance spending and investment not covered by domestic savings.
The U.S. is now the World's largest debtor nation, compared to being the largest
creditor in my generation - which means foreigners now own increasingly more U.S. assets
than Americans own overseas.
If not reversed, this trend looking forward spells dangerous challenges to the U.S.
dollar, as the 'king' of world reserve currencies - and to American living standards.
Said Dr.
Allan Greenspan, Federal Reserve Chairman: "We cannot depend on imported capital,
that is, a current account deficit, to offset low domestic
saving indefinitely. As the G-10 study indicates, even though globalization has led to
large capital flows across national boundaries, domestic investment has remained highly
dependent on domestic saving. This is likely to continue to be the case."
(also see below comments on uncharted territory warnings by Dr.
Lindsey and Dr. Thurow)
 GUESS WHAT FOREIGNERS ARE DOING WITH SOME OF
THAT MONEY
WHO DO WE OWE THE DEBT TO? How about a lot to foreign interests?
Guess what foreigners do with all that cash they earn from our international trade
deficits, since they don't want the goods we produce? In addition to that used to purchase
US companies and liens against firms, they use some of it to buy up liens against our
national government, by purchasing outstanding Treasury bonds and notes - - which we issue
as debt securities to cover our internal debt, which was caused by excessive federal
government spending.
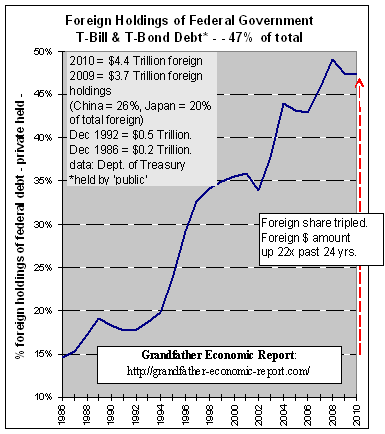
The chart at the left shows that foreign parties now control 49% ($3.1 trillion) of all
our outstanding federal government debt paper owed the 'public', meaning we owe 49% of the public-outstanding private debt payments and
pay-off to foreign interests - - not to U.S. parties. And this $3.1 Trillion does not even
include the added amounts foreigners own of our federal agency debt, such as GNMAs, and
other such government-like debt, nor their holdings of corporate and finance sector debt.
(see the full Federal Govt. Debt Report).
This chart means the average American citizen owes $10,265
in federal debt to foreign interests, because of our nation's excessive federal spending
and our consuming more from the rest of the world than we produce. A family of 4
owes more than $41,060 in this regard, of which 18% is owed to Chinese investors - -
because Japan is running a large trade surplus (not a deficit, as in the U.S.A. - - and,
Japanese are big savers, not with negative personal savings rates in negative territory as
American households. (Imagine whispering to your new born baby that he or she is
responsible for $7,438 in federal debt and interest payments
to children of other nations.)
Note the rapidly rising trend in the past several years,
as foreign holdings zoomed upward since 1992.
We are the world's largest DEBTOR NATION, becoming more so each day, and should not be
surprised that others are financing our consumptive spending binge, and we owe them back.
But, how long will they continue to do so? Suppose they stop financing us. How would we
pay for our imports then, or for our excessive government and consumer consumptive
spending - - instead of producing and saving more? NOW - - Take a look at
the above chart again, and note foreign share in 2002 dropped - - indicating OPEC and
Europe have cut back their share as they observe soaring US trade deficits which could
impact the value of the US dollar they were holding.
Foreigners now own more and more of America - - about "$8 trillion of U.S.
financial assets, including 13% of all stocks and 24% of corporate bonds", according
to Bridgewater Associates. According to the above chart, they also own 44% of all Treasury
bonds. Additionally, they own real estate and factories.
We should not be mad at foreign interests. We are the ones consuming beyond our own production, creating
unprecedented debts and trade deficits PLUS excessive federal spending. We are in deep trouble. (Below is a table of Major
foreign holders of federal government debt)
 FOREIGN RESERVES - USA STAGNATES - - OTHERS
GROW
Foreign reserves are equivalent to a nation's liquid international savings account,
being assets it can freely spend for foreign goods and properties. (keep in mind that said
reserves do not take into account international debts). Bottom-line: the more foreign
reserves a nation has, compared to others, the better.
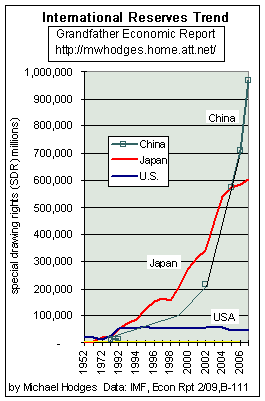
This chart shows foreign reserves each year for the past 55 years. Note how the USA
stagnated since 1992, with zero growth - - as Japan's reserves soared, AND later China's
exploded upward.
Note this chart's data is in International Monetary Fund special drawing right units
(SDRs). The chart data points for 2007 are: China 969,056 SDRs, Japan 603,794 SDRs and USA
95% less at a mere 46,820 SDRs. (2007 IMF exchange rate was $1.58
per SDR)
Just look at the international reserve trend of China
and Japan, compared to the U.S.
Restated in dollars, the 2007 SDR data points are equivalent to China $1.5 Trillion,
Japan $954 billion and USA just $74 billion.
Together, China and Japan own 40% ($2.5 trillion) of total World international
reserves ($6.3 trillion). The U.S. share is just 1%.
Additionally, the USA has tremendous international debts exceeding $10 trillion to more
than cancel out its mere $69 billion in international reserves, whereas Japan has zilch
international debt.
"Asian central banks currently hold about $2.2 trillion, or
80% of the world’s official foreign exchange reserves. As of year-end 2003, BIS
data reveal that dollar-denominated assets made up about 70% of these reserves. Japan and
China account for over half Asia's total foreign exchange reserves," per Morgan
Stanley chief economist Stephen Roach on Sept. 28, 2004.
Do U.S. businesses face a level playing field regarding its regulatory compliance
costs?
This grandfather wants to see the U.S. line on this chart climbing straight up, and
passing all others - - instead of stagnating while others soar.
Additional deficit cause may be attributed to more effective import blocking practices
of other nations, as they better utilize WTO loop holes.
 INTERNATIONAL RESERVES PER PERSON
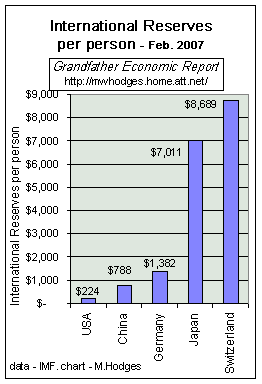
Another way to look at reserves for different nations is on a per capita basis
- - meaning how much international reserves does each nation have backing up each of its
citizens.
As a grandfather, I would prefer the U.S. had more foreign reserves
per child than any other nation - - not less!
This chart compares international reserves per person for 5 nations, from tiny
Switzerland (pop 7.4 million) to huge China (pop. 1.3 billion citizens).
It reveals a dramatic picture - - as of February 2007.
It shows, from left to right >
1. USA with a mere $224.26 in international reserves per citizen, compared to >
2. China with $788 per person (despite its huge population)
3. Germany with $1,382 per person,
4. Japan with $7,011 per citizen,
5. and even tiny Switzerland with $8,689 reserves per person.
Japan has 31 times more reserves for each of its citizens than does the U.S.
Not only is the U.S. significantly lagging other nations in reserves per person, but
also it is the largest debtor nation in the world with an external debt exceeding $12.5
Trillion and continuing record trade deficits.
(data is from the International Monetary Fund (incl. gold) and US
Economic Report of President to Congress, 2/07, table B-111)
A SOBERING VIEW: posted 20 September 1997 in newsgroup
alt.politics.economics, by Wayne Crimi in response to Michael Hodges' posting question of:
"Bottom-line: we consume more than we produce, and this cannot continue forever
- - especially now that Europe is moving to a single currency."
Response: >>"I agree. In my view the recent strength of the dollar is
related to some very special cyclical circumstances. Both Japan and much of Europe have
been experiencing weak economies relative to the U.S. The large interest rate differential
has attracted capital to the U.S as a result. In addition foreign central banks, until
this spring, have been amassing billions of dollars of U.S. treasuries which also helped
support the dollar. They accumulated about 100 billion a year for 2 years. There is also
uncertainty related to the Euro. Net last year foreigners lent us 405 billion.
Over time the accumulation of U.S. treasuries via our current account/trade deficit
will pose serious problems for the U.S. The associated interest payments
compounding over time + the trade deficit will make it very difficult to get things under
control. This could have very serious implications for the dollar and the economic health
of the U.S. This inflow of capital is also a primary reason for the stock market explosion
in the last 2 years. (unsustainable). The U.S. personal
savings rate is now the lowest ever. With our trade/current account deficit money
financing our debt via foreigners, Americans have been free to consume more and use their
meager savings to buy just stocks instead of financing our expansion.
When the cyclical portion of this reverses (Japan strong, U.S. weak) we will see a
slowdown of these inflows. It will require higher rates to continue attracting this money
or to generate it domestically. Stocks which have been propped up by all this will return
to more normal values. (much lower)
In my view this is all going to end very, very badly. The trade deficit has been
a problem for 15 years. We are now a very large debtor nation. If we don't do something ,
we will live here, but others will have claims on the assets and incomes. This translates
into control over the politics.<<"
Another related item: on 18 Sept. William Hummel posted in sci.econ that "as of 30
June 1997 our monetary base was $455 billion, of which $408 billion is in currency
(reserve notes) - and, two-thirds of our currency is in foreign hands." That
two-thirds figure is a scary statement. And that was 7 years ago.
WHO IS WRITING THE RULES FOR TOMORROW'S WORLD TRADING SYSTEM - the
U.S. or others?
In 'The Future of Capitalism,' 1996, author and M.I.T. economics professor Lester
Thurow wrote:
"The rules for the new world order are being written in Brussels. The
Common Market is now the world's largest market, and those who control the conditions of
entry into the largest market have always written the rules for world trade. England did
so in the 19th century, replaced by the U.S. in the 20th century. To some extent the
European Union will write the rules for world trade simply because it is the only
international group in the rules-writing business. It will write rules for those inside
the EU and tell those outside how they can gain entry. Whatever it writes for outsiders
will be copied by others as their rules governing outsiders."
This statement shows our young generation face a major challenge regarding 'who is
in command of world trade,' compared to prior generations.
See also The EURO - about the
new European single currency
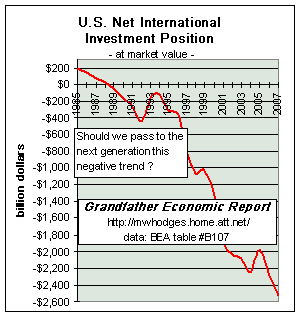 DETERIORATING
U.S. INTERNATIONAL NET INVESTMENT STATUS
This is a dramatic chart, a chart of America's exploding negative NET WORTH.
This chart plots the sum of all the assets we Americans own abroad, plus all our gold
and foreign currency, and then subtracts the higher value of foreign-owned assets in the
U.S. - - called the U.S. International Investment Position at the end of each year shown.
This shows a significant negative trend against the U.S., compared to a balanced
status just 15 years ago.
In 2007, the net international investment balance was a $2.6 trillion deficit,
as shown on the chart - the worse in history. (President's Economic Report to
congress 2/2007, table b-107). Adding 2007's current account deficit of $698
billion increases negative net worth to over $4 trillion as of beginning
2008.
Why are we allowing this negative status and trend to be passed on to the next
generation?
Where is the plan to correct the on-going international debt build-up and asset transfer
due to negative trade performance?
Leave it to my children &
grandchildren?
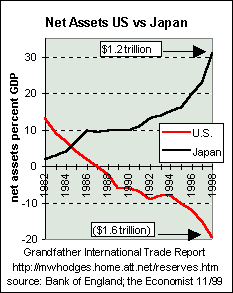 NET FOREIGN ASSET POSITIONS % GDP - U.S.
VS. JAPAN
Net Asset is a measure of the difference between a nation's foreign assets and its
foreign liabilities. One good way to compare nations and their relative trends in net
assets is to compare the value of same as ratio to the size of their respective economies
(GDP). This chart does that.
The left chart's red line shows the U.S. has a rapidly declining position, and
is strongly in the red with a rapid deteriorating trend - - with net liabilities of about
20% of GDP (or, minus $1.6 trillion). (by 2003 this ratio soared to 45% of GDP for
the U.S.) The U.S., the world's largest debtor nation is becoming bigger debtor
each year. Also note from the chart that America's red ink, as a percentage of its economy
size (GDP), doubled during the 1990s.
The left chart also shows Japan's net foreign assets (black line) are strongly in the
black and growing upward rapidly in a positive manner, reaching 31% of GDP in 1998 - -
about $1.2 trillion in value. Japan, therefore, is a huge creditor nation - which
increased its net position relative to GDP in the 1990s by three times.
Some might say that in the 1990s America had a strong economy, but this chart shows
such was not internally driven by asset creation but driven by expanded international
indebtedness. In addition to this driving force of increased international borrowing, the America's Total Debt Report includes dramatic graphics documenting
the record internal debt created in the U.S. during this period - - also an all-time
record high.
The divergent trends shown in this chart are most dramatic
This further erodes the standard of living of the U.S. worker.
One main factor may be our sliding educational system vs. that of our major
trading partners, especially when it is reported that the U.S. spends a higher percentage
of its national income for education than others.
This may also be coupled with our propensity to spend larger portions of our economy on
consumptive goods and social expenses, and less on productivity enhancement infrastructure
and competitive investments.
And, as seen in the Grandfather International Education
Report, foreign nations are several times more intense in using both their
universities and ours to develop a higher percentage of math, science and engineering
graduates. There are reports that 57% of the new PhD's in math from our
universities, and approximate half our science, engineering & math graduates, are foreign
students.
The next generation may pay quite a price for our negligence.
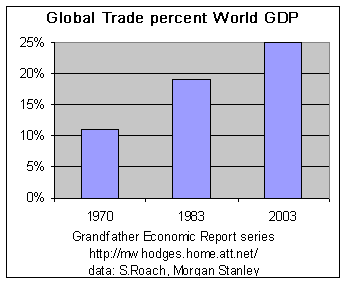 WORLD
GROWTH DEPENDENT MORE UPON GLOBAL TRADE
The following chart shows that world GDP growth has become two times more dependent on
global trade during the recent past, while those trade deficit charts above show the U.S.
is becoming less and less productive/competitive regarding U.S.-produced products.
About this chart : "By our estimates global trade in goods and services now
amounts to 25% of world GDP, up dramatically from the 19% share just ten years ago and an
11% portion in 1970. Over the past 17 years, 1987 to 2003, surging global trade has
accounted for fully 33% of the cumulative increase in world GDP. By contrast, over the
1974-86 period, trade accounted for about 17% of the cumulative increase in world GDP. In
other words, since the late 1980s there has been a virtual doubling of the role that trade
has played in driving the global GDP growth dynamic. There can be no greater testament to
the power of globalization.
A new and powerful global labor arbitrage has led to accelerating transfer of high-wage
jobs from the developed world to lower-wage workforces in the developing world. Enabled by
the Internet and the maturation of vast offshore outsourcing platforms in goods and
services alike, labor has become more “fungible” than ever. In a world without
pricing leverage, the unrelenting push for cost control gives a sudden urgency to this
cross-border arbitrage. The outcome is a new and potentially lasting bias toward jobless
recoveries in the high-wage developed world."
(Morgan Stanley Global Economic Forum, 11/24/03, Stephen Roach, chief economist http://www.morganstanley.com/GEFdata/digests/20031124-mon.html#anchor0
It is clear the U.S. must implement policies that reverse its decreasing interest to
the world regarding products and services it produces of interest to others.
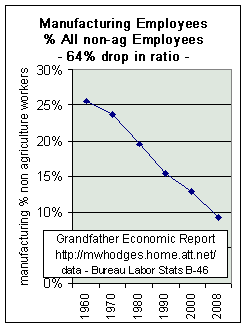 Causes
of Trade Deficit = manufacturing
decline plus rising oil imports
PLUS > soaring debts all sectors pushing consumption (incl. imports) beyond
incomes.
The left chart shows the trend of the number of manufacturing
workers as a percentage of all U.S. employees (non-agriculture) - - from 26% in
1960 to 9.7% in 2007, a 62% drop in the manufacturing ratio.
On a GDP basis the trend is the same negative > the U.S. manufacturing
base declined from 30.4% of GDP in 1953 (when we had a trade surplus) to 11.7% in
2006 - also a 61% drop in the manufacturing share of GDP - and more is
foreign-owned than before. (Bureau Economic Analysis table b-12, Economic
Report of President, appendix table)
As shown by the merchandise trade chart above, whereas in 1960
U.S. goods manufacturing produced a $5 billion trade surplus - - 2006 merchandise trade
had a $836 billion deficit. A powerful negative swing.
As America's production of goods has become a much smaller share of the economy the
export share of national income stagnates and declines and the import share soars.
Bottom-line > manufacturing base
shrinkage is a major negative regarding trade balance, and a major negative impact on U.S.
economic and national security independence and future living standards.
Note that the down-sloping trend of this chart far pre-dates the opening of
China as a major world manufacturer.
According to the Chinese Statistical Yearbook and economist Steve Roach of Morgan Stanley
(4/05), the average Chinese manufacturing worker made 12,496 yuan in
2003, which translates into about US$29 per week. By
contrast, average weekly earnings of US manufacturing workers amounted to $636 per week in
2003. With Chinese manufacturing wage
levels only 4.5% of their US counterpart, my back-of-the envelope calculations
suggest it would take about 20 years of sustained 15% annualized Chinese wage inflation to
close half the wage gap with the US. Don’t kid
yourself. Even with Chinese wage inflation, the
economics of the labor arbitrage between the US and China remain compelling for as far as
the eye can see.
Loss of price competitiveness has even affected high-technology goods, with
resulting large deficits in those industries as well. Examples include office equipment
and automatic data processing equipment (a 1999 deficit of $36 billion) and
telecommunications equipment (a 1999 deficit of $23 billion). Source -Trade
Deficit Commission.
There are zillions of items on which America depends on foreigners to supply. Most know
America is dependent on foreigners for 60% of its oil. However, few realize that America
is 100% dependent on foreigners (British and French) for flu vaccines needed by senior
citizens. A nation that will not produce its own flu vaccines is not a very smart
nation.
Some try to blame the US manufacturing base decline on an artificially
high foreign exchange rate of the US dollar, which they say negatively impacts US producer
costs on an international basis. While this may be correct now and then, the Exchange Rate Report's long-term trend chart proves
the dollar's exchange rate has declined significantly over the same period as the above
chart's manufacturing decline. Additionally, this International
Trade Report's current account and mercantile trade trend charts clearly show
large deficits even though the exchange rate fell. And, as shown in that report, for
decades Germany, Japan, and even tiny Switzerland have maintained significantly stronger
currency exchange rates vs. the dollar, while realizing continuing trade surpluses. So, the
exchange rate excuse is just that > an excuse !!
"The deficit continues to be driven by poor U.S. performance and the rapidly
rising tide of interest and dividend payments to foreigners who hold an ever increasing
share of the American economic pie. Longer term, we run the risk of giving up more control
of the economy." Michael Fenollosa, economist at John Hancock
Financial Services to International Herald Tribune, 3/97.
Therefore, the trade deficit is
significantly influenced by the following:
- Debt-based consumption - soaring trade deficits due to
stagnation of exports despite reduced dollar exchange rate - and soaring import ratios,
much driven by debt - - which in turn is much influenced by Federal Reserve manipulated
interest rates. Certainly the lowest interest rates in decades as set by the Federal
Reserve has much to do with fostering more debt to support more consumption which in turn
includes more imports. With the highest debt ratios in history for most sectors, interest
rates should also follow to record highs - - but cannot if manipulated.
- Manufacturing decline - - as covered above.
- Soaring debts all sectors and record debt ratios, further promoted by
record low interest rates to make debt 'more fun' - - accelerates consuming beyond
national production and savings, as shown in America's
Total Debt Report, causes more imports than would be the case.
- Soaring oil imports - - As shown in the
Energy Report, America's oil production has declined to record lows with
declining reserves, and as consumption climbs the consumption-to-production gap climbed to
71%, with soaring imports making up the difference.
- Regulatory Compliance Costs - - see
this graphic report for other insights. Obviously the more the US, with perhaps the
highest regulatory cost % national income in the world, must compete with nations with
much, much less regulatory impact on producers, the worse the relative potential
manufacturing and trade performance.
- Government Spending 43% share of the
economy, including the federal social spending
ratio which has increased dramatically during the same period as declining manufacturing
ratios. Additionally, the number of state & local
government employee continues to increase faster than general population
growth - - and most of those employees have better health coverage paid by tax payers than
taxpayers have for themselves.
- Some might add to the list - - Lawyers per capita in USA highest in the world,
by far. Data shows one can rank nations and find that those with the highest number of
lawyers per capita also have the worse international trade performance. While America has
the highest density of lawyers it also has the greatest current account (foreign trade
competitiveness) deficit ratio to GDP. Japan with the fewest lawyers per capita has the
world's highest trade surplus. Current account data 2003 shown here is in the same
order as lawyers per capita for these nations: USA 5%
GDP deficit, Britain 2.1% GDP
deficit, France 1.3% surplus, Japan
3% surplus. See Lawyer Report with graphic comparing USA lawyers per
capita with other nations.
- Additional deficit causes may be attributed to more coordinated and effective import
blocking practices of other nations, whereas they better use and/or control WTO
loop holes and local regulations than does the U.S.
For example, it has been reported that WTO rules permit many major trading countries to
rebate value-added taxes on their exports and impose these taxes on imports. The United
States is much more dependent on corporate and personal income taxes to finance government
than other countries, and WTO rules prohibit the United States from making similar border
tax adjustment for income taxes on exports and imports. The average standard value-added
tax in the European Union is 19%. When rebated on exports and applied to imports, these
adjustments provide a 19% subsidy on EU products sold in US markets and a 19% import
tariff on US products sold in EU markets. China offers similar benefits to its
manufacturers. If this is the case, the U.S. Congress should re-balance this type of
'playing field' immediately regarding tax rebates and also reconsider its
membership in the WTO.
Instead of debasing the US dollar while promoting policies to drive debt
records in all sectors,
the US must take action >
- Regarding excessive debt [and official manipulations (interest rates)
which promote debt over savings], and soaring debt ratios,
- Petroleum import and consumption ratios,
- Regulatory compliance costs,
- Declining saving rates,
- Declining manufacturing base ratios,
- Government spending ratios and trends,
- and even, believe it or not, take a look at lawyers per capita in the USA
out-pacing all other nations by far.
One should not try to get around attending to the above actions by playing
games > such as calling for a 'level playing field' > defined as
commanding that all other nations must change their culture and economy so as to also have
US debt ratios, US regulatory compliance cost burdens, US record low saving ratios, US
manufacturing ratios, US government spending ratios, or US lawyers per capita. The US must
clean its own house - - and stop blaming others or playing ostrich.
Readers are invited to submit their recommended additions to this priority
list, together with data backup - by email.
DOES IT MATTER - - THESE DEFICITS??
- Federal Reserve Chairman Alan Greenspan said, "We cannot depend on
imported capital, that is, a current account deficit, to offset low domestic savings
indefinitely."
- On 30 April 2001 White House Economic Advisor Dr. Lawrence Lindsey
said, "We are in uncharted territory - - it's unprecedented - - it cannot go
on - - something has to give."
- MIT economics professor Dr. Lester Thurow said, "No
country can run a large trade deficit forever."
- The U.S. Trade Deficit Commission, December 2000, said,
"Not only is the trade deficit not sustainable but that it carries a great deal of
danger to the nation and living standards.
THESE TRADE DEFICITS
SPELL DANGER - - Uncharted Territory
"It is unlikely we could forever borrow 4% of GDP from the rest
of the world.
We have never been that overextended before. Something has to give."
On April 30, 2001, White House Economic Advisor Dr. Lawrence Lindsey,
speaking at the annual convention of the Society of American Business Editors and Writers,
said: ""I do think it is important that we all keep this in mind: we have had 20
years of expansion - 18 actually, going on 19. And it has been an extraordinary period.
But that does not mean that everything is AOK. And I think that it is important to keep in
mind what I think are three imbalances. They actually all come up to one imbalance.
And let me sum it up with these statistics. Last year the private sector spent $700
billion more than it earned after taxes. (repeating) The private sector spent $700
billion more than it earned after-tax. Now that is 7% of GDP. We have never been there
before. We are making up that 7% essentially from two sources. The public sector ran a
3% of GDP, roughly, surplus. And we took in 4% of GDP by borrowing from abroad. But in
terms of being overextended, we have never been that overextended before. There is
a lot of confusion between the health of the government's books and the health of
America's books - they are not the same thing. The public sector ran a healthy
surplus…taking a record share from the private sector. The private sector is
running a record deficit. (see America's Total Debt Report)
We are in uncharted territory. We don't know how this is going to work out. But it
is unlikely that we could forever borrow 4% of GDP from the rest of the world. Or more
precisely if you look at trends, we are borrowing increasing amounts from the rest of
the world. Imagine going to your banker and saying "we thank you very much for
the $280 (billion) you lent us in 1999, and the $400 (billion) you lent us in 2000, and it
looks like this year it is going to come in about $520. We are going to need $650 in
additional cash in '02, probably $800 in '03." Getting the picture? This is otherwise
known as "evergreen" financing. And it won't work. At some point, it is going
to have to be adjusted. I remember stories from the '80s. Many of you are probably too
young. But our personal savings rate - that we moaned as being far too low - averaged 9.1%
of GDP. Last year savings were in negative territory.
The first quarter of this year savings was minus 1%, the lowest since 1933.
Similarly, if you combine personal savings with gross private savings minus gross private
spending, we were short last year 5.4% of GDP. That is also a record. Unprecedented. It
has to be adjusted. Something has got to give here…"
"The United States' net indebtedness to the rest of the world is approximately $3
trillion or 30% of US GDP. It increased by approximately $500 billion, or 5% of GDP, last
year (2002) and it will increase by a similar amount again this year (2003) and the year
after and every year into the future until a sharp fall in the value of the dollar against
the currencies of all its major trading partners puts an end to the gapping US current
account deficit or until the United States is so heavily indebted to the rest of the world
that it becomes incapable of servicing the interest on its multi-trillion dollar
debt." This report includes an excellent summary of what happens to the dollar
earnings of foreign interests from the US current account deficit. (Richard Duncan,
May 2003 - http://www.financeasia.com/articles/E867AEB6-642E-11D7-81FA0090277E174B.cfm).
Author note > as seen in the above charts, the U.S. cumulative indebtedness
(transfer of wealth in the form of assets sold and debt owed) with the rest of the world
increased to about $5 trillion by year end 2004.
Here's more supporting evidence: the U.S. Trade Deficit Commission - Dec. 2000. Enlightened
reading, showing all commissioners, from both parties, are deeply concerned that not
only is the trade deficit not sustainable but that it carries a great deal of danger to
the nation and living standards. No real solutions are proposed with any consensus.
A WARNING: M.I.T. economist Lester Thurow, ('The
Future of Capitalism' pg. 17, 1996): "There is one rule of international
economics, it is that no country can run a large trade deficit forever. Trade deficits
need to be financed and it is impossible to borrow enough to keep up with compound
interest. Yet all world trade, especially the Pacific Rim, depends upon most of this world
being able to run trade surpluses with the U.S. that will allow them to pay their trade
deficits with Japan. When lending to America stops, and it will stop, what happens
to current world trade flows?"
About the past several years, one writer reported: "If the
US enjoys higher "productivity" why has the trade deficit doubled during
the last two years? In an economy that is mostly based on "services", how
can higher "productivity" generate the funds that will be needed to repay the
debts, which financed a trade deficit that consists mostly of "goods"?
Will 10 million Japanese and 20 million Chinese come every year to tour the US? How can
competitiveness rise as the result of higher "productivity" if at the same time
the trade deficit doubles? What competitiveness? Of burger flippers and Internet
service providers?"
Some claim productivity has increased in recent years which increases U.S.
international competitiveness, yet the Productivity Report shows
not only is productivity lower than prior generations but all of the so-called recent
increases can be attributed to two factors: changing measurement criteria for inflation
and GDP and the fact that even then nearly all of the so-called increase was in a very
narrow part of the economy. Some say 'inflation is dead' which also increases U.S.
competitiveness, but the Inflation Report shows today's
inflation is much higher than prior generations, despite government changing measurement
criteria for the past several years to make it appear more benign. It can be seen that the
pattern since the mid 1970's brings into focus the basic question above - - America's lack of competitiveness world-wide - - increasingly so each
year. This indicates the U.S. has become less competitive, despite claims of recent
improved productivity (mostly realized only by a narrow part of the economy and primarily
by revising how they measure productivity and inflation).
Despite all these 'improvements' - -
the above chart shows our growing lack of competitiveness as we increase foreign debt
at a faster pace.
USA TRADE DEFICIT BY NATION (nations
comprising 90% of total USA deficit)
|
2007 USA Deficit
(in billions of dollars) |
2005 USA Deficit
(in billions of dollars) |
2005 % total
USA deficit |
| China |
$256 |
$202 |
27% |
| European
Union |
|
$122 |
16% |
| OPEC |
|
$93 |
12% |
| Japan |
$83 |
$83 |
11% |
| Canada |
$65 |
$77 |
10% |
| South/Central America |
|
$51 |
7% |
| Mexico |
$74 |
$50 |
7% |
| Germany |
$45 |
|
|
sum above |
|
$678 |
90% |
MAJOR FOREIGN HOLDERS OF TREASURY SECURITIES
You have seen the Above Trend Chart of Govt. Debt to Foreigners
Here is a listing of the major foreign holders of that debt as of date shown.
| (in
billions of dollars) |
Dec 2007 |
Dec 2006 |
Dec 2005 |
Jan 2005 |
| Japan |
581 |
623 |
685 |
701.6 |
| Mainland China |
478 |
397 |
257 |
194.5 |
| United Kingdom |
157 |
239 |
234 |
163 |
| Caribbean Banking Centers2/ |
117 |
68 |
111 |
92.5 |
| Korea |
39 |
70 |
67 |
67.7 |
| OPEC |
138 |
101 |
67 |
64.7 |
| Taiwan |
|
63 |
71 |
59.2 |
| Germany |
42 |
53 |
67 |
57.1 |
| Hong Kong |
51 |
54 |
44 |
52.9 |
| Switzerland |
39 |
27 |
37 |
50 |
| Canada |
18 |
48 |
63 |
43.4 |
| Mexico |
35 |
34 |
38 |
41.1 |
| Luxembourg |
70 |
39 |
40 |
29.3 |
| Singapore |
40 |
31 |
27 |
27.6 |
| Ireland |
19 |
18 |
11 |
21 |
| Belgium |
13 |
17 |
18 |
16.5 |
| Israel |
|
16 |
11 |
16 |
| Thailand |
27 |
17 |
13 |
15.8 |
| Italy |
14 |
14 |
18 |
14.9 |
| India |
15 |
14 |
13 |
13.9 |
| Turkey |
26 |
22 |
16 |
12.8 |
| Spain |
|
? |
? |
12.2 |
| Brazil |
130 |
52 |
27 |
12.2 |
| Sweden |
14 |
17 |
19 |
11.6 |
| Australia |
|
? |
? |
9.7 |
| France |
11 |
30 |
27 |
9.2 |
| Netherlands |
15 |
18 |
11 |
8.7 |
| Poland |
13 |
14 |
13 |
? |
| All Other |
|
154 |
146 |
141 |
| Grand Totals |
$2353.8 |
$2,223.5 |
$2,176.5 |
$1,960.3 |
2/ Includes Bahamas, Bermuda, Cayman Islands, Netherlands Antilles, and Panama
Department of the Treasury/Federal Reserve Board - 2/15/2007
http://www.treas.gov/tic/mfh.txt
National Security
and Hi Tech Jobs
America's declining share of IT and communications equipment
As you read the following think about implications regarding hi tech jobs
and national security. Obviously if the USA is less and less successful regarding
providing the highest hi tech products, IT and communications equipment, such spells
ominous implications for the future. Consider the following:
Morgan Stanley economist Steve Roach,
Sept. 2006, reported an excellent analysis by Catherine Mann of the Institute for
International Economics that illustrates the rapidly shifting market shares in global
exports of two of the world’s newest and most rapidly growing product lines --
information technology hardware and communications equipment (see Mann’s, Accelerating the Globalization of America, IIE,
2006). "In both cases, China has come from
virtually nowhere as recently as 1990 to attain positions of global dominance in 2004. The gains in market share have been especially dramatic
since 2000, when China still ranked #13 in global market share in IT and #5 in
communications equipment. A scant four years later
and China was #1 in the world in export shares of both of these key product lines.
Of course, the flip side of China’s
rapid ascendancy has been the equally swift decline in global leadership of the former
titans -- especially Japan and the United States. For
IT products, Japan went from a #1 position of 20.4% of all global exports in 1990 to #5
with just a 7.9% share in 2004. Meanwhile, US
market shares in IT exports went from 19.3% in 1990 to 11.0% in 2004. A similar decline is evident in communications
equipment. Japan went from an overwhelmingly
dominant position with 26.7% market share in 1990 to #5 with just a 6.9% share of global
exports in 2004. US market share in global
communications exports was essentially cut in half over the same period -- from 13.9% and
a #2 position in 1990 to a 7.0% share and a #4 position in 2004. Interestingly enough, Germany has held its own in both
of these two leading-edge export businesses; its 6.9% share in global IT exports in 2004
is only fractionally below that prevailing in 1990, whereas its share of global
communications equipment actually inched up from 7.4% in 1990 to 8.9% in 2004."
Note
how Germany actually increased its share of world exports regarding IT and
communications equipment - - DESPITE being one of the world's highest paid labor forces -
together with having a strong (not declining) currency (the Euro). This is just
another of many examples proving that hoping a declining exchange rate will help the U.S.
is a bogus hope.
This
article also lends weight to the argument that the U.S. is less and less able to compete
in the hi tech arena, since the U.S. continues to come in near last on international math
and science exams - - as reported in the International Math
and Science Test Report.
ENERGY FOREIGN
DEPENDENCE INCREASING
Energy-dependence - The Energy Report chapter
graphically shows declining oil production to 50-year lows, but now we have 123 million
more people than then - - with soaring consumption, declining reserves and zooming imports
to cover our 70% production-consumption deficit. The U.S. has become more dependent on
imported foreign oil and gas than ever before - - which has both economic and national
security implications.
WHAT TO DO?
It has been said that there are only three ways in which negative trade
balances can be restored: (1) the deficit-incurring country (USA) must cease
excessive credit (debt) expansion which sucks in imports faster than incomes warrant and
allow interest rates to climb to reverse debt ratios, (2) other countries must inflate
their economies to over-price their own production so as to suck up more U.S. exports, (3)
the deficit country (USA) must allow its currency to depreciate to drive up prices.
What's happening? Answer (1) USA increases debt even faster (see America's Total Debt Report), while (2) crying for other countries
to inflate away their currency and grow their imports from America, and (3) allowing
depreciation of the US dollar (see Foreign Exchange Report),
causing a loss of international buying power of every US wage earner and holder of dollars
- to the tune of negative 40% against the Euro in recent years.
One should not accept leaders hiding-out by calling for a 'level playing
field', demanding (as if they have a right to demand) that all non-Americans change their
nations to also have huge, soaring debt ratios, near zero savings rates and a declining manufacturing base like
America's, with U.S. regulatory compliance cost burden
ratios, or even the number of U.S. lawyers per capita. The
US must clean its own house. These are covered in the full Trade Report - - link below.
What should happen to those powers-to-be who
promote and allow degradation of our currency, our international net worth, and foreign
reserves per capita (the international buying power of its citizens) - - and what should
happen to those who promote tax and interest rate policies which drive debt and
consumption instead of production and savings - - or about those who make America's
future living standards and national security more and more dependent and beholden to
non-Americans?????
Is that the proper legacy to pass along to
our children and grandchildren? This author thinks NOT !!
For additional information and charts concerning the international situation, go to the
Grandfather International Education Report and the Grandfather Foreign Exchange Report
Is a contributing factor the fact that our private sector's relative share of the
economy has dropped for so many years, due to government size expansion
faster than economic growth? We have seen the chart before
in the Grandfather Government Spending Reports
Once total government spending increased above 30% of national income (late 1960s)
the U.S. ceased to realize balanced trade results, and thereafter exploded to massive
trade deficits - - regardless of whether the international value of the U.S. dollar was
weak or stronger. This suggests total government (federal + state/local) spending must
be reduced by one-forth from its current levels - - as well as reducing regulatory
compliance costs impacting our shrinking manufacturing base.
ACTION OPPORTUNITY
We should be decreasing America's Total Debt
ratios (both government and private sector debt), and the government spending
dependence of our economy. As Europe moves to a more centralized, bureaucratic government
via the European Union, the U.S. response should be in the opposite direction - - to our
relative strength of the past - - a smaller and smaller share of our economy dependent on
government spending and debt.
Our government dependence and our private plus government debt-dependence has loomed so
large, leading many to believe that only government and debt and manipulated interest
rates can solve America's serious imbalances looking forward. Many government bureaucrats
actually believe they can solve our trade imbalances, but such gets worse. First, their
actions resulted in a decline of the U.S. dollar (in other words, by giving all workers an
effective cut in pay (in international buying power terms), and still trade balances
deteriorated. Then came negotiated trade restraints, called voluntary and 'level playing
field' creators. Deficits worsened, just shifting momentarily from say Japan to China. Now
its on to NAFTA expansion and the World Trade Organization, as a mechanism to which our
bureaucrats can file complaints with other bureaucrats - - still believing bureaucrats
have all answers. They are wrong in all cases.
Of course bureaucrats and politicians never contemplate doing that which will resolve
all such problems. The SOLUTION: reducing the government
spending share of our economy and private and government debt ratios,
together with regulatory compliance cost ratio reduction - -
to free-up the private sector - - coupled with tax rate reductions
and free-market (instead of manipulated) interest rates to encourage
savings and reduce incentive for debt. There is no other proper course, that is if in
fact we care about making our nation more competitive, more free and improve our legacy to
the next generation.
CHALLENGES OF THE FUTURE
OUR AGING
POPULATION AND RELATIVE EDUCATION QUALITY
One area eating at our nation's competitiveness is government-operated pension and
medical programs for seniors, and the looming time bomb of demographics of a rapid
increase in the population of seniors. Trend graphics of the USA vs. other major
industrial nations showing comparative government spending ratios and the accelerating
burden of seniors is in the International Comparison Report .
The nation that best responds to this challenge may gain a future comparative advantage.
Color graphics showing trends today vs. prior generations for USA-only are in the Social Security Report.
Another challenging area relative to future competitiveness in an increasing
technological-oriented world is the poor relative performance of USA education quality vs.
other nations: see the International Education Report and
the latest Report on International Math & Science Exams
showing USA students in control of last place. The full Education Report on all
quality/spending issues is in the Master Education Report.
EXCHANGE RATES, INFLATION and
REGULATORY COMPLIANCE COSTS
Long-term exchange rate trends of major industrial nations are in the Exchange Rate Report. And, although the Inflation Report shows today's USA inflation rate is lower than
in the past, it is even lower in other major industrial nations - - giving them a
comparative advantage. The recent lower inflation rate experienced at home is not
necessarily caused by local actions but more from falling commodity prices - which will
not continue forever. The USA will have to strive for lower inflation rates than its major
competitors.
The cost of government-mandated regulatory costs compared to the past can impact trade
competitiveness. See the Regulation Cost Report, for color
graphics.
NATIONAL SECURITY
Increased reliance on foreign trade for all goods, including more consumer goods, plus
energy raises questions regarding national security, especially
since our nation's relative manufacturing base is so much smaller and government's share
of the economy is so much larger - - compared to the economic capacity America had to
effectively meet the great surprise of a 2-front global war called World War II.
QUESTION:
What thoughts come to your mind ? Are you convinced that our youth face real economic
challenges in the international competition arena compared to many years ago that must be
eliminated ? Are you proud of the situation we are passing on to them?
ACTION, or NO ACTION ?
Exchange information with Michael Hodges via E-mail
Constructive input and links are welcome.
RETURN TO THE HOME PAGE of the
Grandfather Economic Reports
GO TO THE TOP
| Home & Contents | Summary | Feedback | What's New | Link Index | Eye-opener | Must See |
Grandfather International Trade Report: https://grandfather-economic-report.com/reserves.htm
Copyright © 1997-2011 Michael W. Hodges.
The Grandfather Economic Report series is the
intellectual property of its author; all rights reserved under Copyright Conventions.
Permission to redistribute all or part of this series for non commercial purposes is
granted by the author, provided the associated web page address is included and full
credit given to the Grandfather Economic Report and the author, Michael Hodges. Notice
appreciated via email.
 Quick Links: Questions & Items - - Trade Dependence - - Goods Imports - - Trade
Balance annually - - Trade Balance cumulative - - Deficit
with China - - Current Account - - Govt. Debt to
Foreigners - - International Reserves - - Net
Asset Trend - - Global Trade Ratio - - Manufacturing
and other reasons - - Why Deficits Matter?- - Uncharted Dangerous Territory - - Trade Deficit by
Nation - - Major foreign holders Treasury debt - - Aging Population - - Hi tech and National Security
- - Energy threat - - What to Do
 When
we speak of competing in a global economy,
  Notice imports (red curve) of goods - - zooming
higher, as a share of our economy,
 Consumer
goods are more and more fueled by imports, not local production.
  This chart measures the U.S. merchandise (goods, excluding
military) trade balance since 1959. Up until the mid 1970s a positive balance of trade was
realized, which demonstrated a past ability to remain sufficiently competitive in goods to
cover our import needs, no matter what they were.
 Next is a comparative chart of USA deficits with
one nation,
 The left chart is a plot of the cumulative
current account deficits- - meaning the sum of annual deficits since 1974.
 GUESS WHAT
  FOREIGN
  INTERNATIONAL RESERVES PER PERSON
 NET FOREIGN ASSET POSITIONS % GDP - U.S.
VS. JAPAN
  WORLD
GROWTH DEPENDENT MORE UPON
  Causes
of Trade Deficit =