
The Grandfather Economic Report home page lists chapters showing many challenges.
Here you will find Summary Pictures on 5 core problems
Grandfather Economic
Report series
| Home
& Contents | Feedback & endorsements | Send E-Mail | Send
a link |
Picture Summary of 4 Core Threats |

The Grandfather Economic Report
home page lists chapters showing many challenges.
Here you will find Summary Pictures on 5 core problems
Each generation hopes their children and grandchildren will achieve more economic potential and more individual freedom than prior generations. As a new grandfather I researched economic conditions and education quality facing the generation of my infant grandchildren and their parents, compared to that faced by my generation when their age. The results are available to you in a series of free mini-reports listed on the home page - with explanatory pictures.
There are so many great & positive things about our beloved America to celebrate. But, there are also some negative trends. Perhaps if more are aware of the negatives even more solutions & positives will result.
The objective of these reports is to increase awareness of certain disturbing items, using an easy-to-understand format with hard data presented in picture form.
(for insight into how this report series was born and some very kind remarks, at bottom of page are links to: (1) a Tribute to Nobel laureate Dr. Milton Friedman, and (2) Feedback from parents, professionals, and students from many regions & nations)
KNOWLEDGE IS POWER - - IF YOU HAVE IT, based on hard data.
THIS PAGE WILL SUMMARIZE 5 CORE THREATS
including pictures
- a picture is worth a thousand words -
Here are 5 internal links which you can skip now, and use later: #1 Government Dominance - - #2 Education Quality - - #3 Debt Dependence- - #4 Dependence on Foreigners
SUGGESTION - Before clicking any of the following links, read the full page to understand the 5 Core Problems, then return to the link of choice
 #1 Core Problem: INCREASED GOVERNMENT-DOMINANCE OF OUR ECONOMY
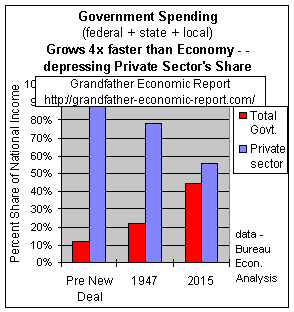
This chart shows how combined spending by federal, state and local government increased faster than the economy - - reducing the share of the economy previously assigned to the pure private sector.
The red bars in this chart show the upward march of combined federal, state & local government spending growing 4 times faster than the economy - - from a 12% share to a 45% share today.
The blue bars in the chart show the reciprocal downward slide of the private sector's share of the economy, as it lost 33 points of its prior share of the economy (from an 88% share down to a 55% share) - - due to government spending growth.
And, more and more of that increased spending is funded by debt, more and more of which requires lending by foreign institutions or simply printing money out of thin air.
Unless the government share of the economy is significantly reduced to at least the 1947 ratios, sometime in the future there may occur major economic and/or national security impacts.
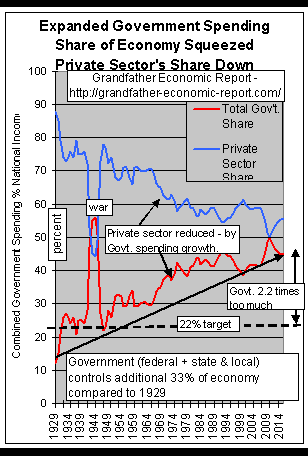 The left chart shows the increasing
long-term trend of the share of the economy consumed by government spending (red line),
compared to the reciprocal shrinkage of the private sector's share of the economy (blue
line). Note the red line surge most recently to a new time record.
QUESTION: HOW BIG SHOULD GOVERNMENT BE - - recognizing our founding forefathers intended limited government?? (as specifically defined by Article I, Section 8 of the Constitution )
Was 12% of the economy enough - - or should
government control more than today's 45% of the economy's national income??
(Many believe federal + state/local government should not
exceed a 20% share of the economy, as shown in the middle bar. To reach that 20% share of
the economy, government spending would need to be half of what it is - - or today's
spending levels must not be allowed to rise, even considering inflation, until the
economy's size has doubled - - or a combination of these: cuts and future freezes).
The Government sector has grown 4 times faster than the economy since I was young (see growth progression pictures and government spending report). Federal government spending increased 8 times faster than the economy and nearly all was consumptive social spending, a category not included by the framers of the Constitution as their 4-principal reasons for creating a federal government. And its not just Washington - - State & local government spending also increased much faster than economic growth and, since 1999, the number of their employees increased 40% faster than general population growth. And, debts exploded.
Government is not a 'free-lunch' - - citizens now work 3 times longer per year to pay all taxes, more than they pay for food, housing and clothing combined, reducing their freedom of choice. Government growth reduced the private sector from 7.3 times larger than the government sector when I was young to just a 1.5 ratio today, a huge drop.
Increased government (at all levels) not only consumes national income by its spending but their employees continually issue new regulations aimed at the reduced private sector, with the cost of compliance passed to the private sector as un-funded mandates to the tune of 15% of national income. Adding this 15% to the above graphic's 45% spending ratio increases government's control-share of the economy to 60% - - as per the regulation cost compliance report chapter.
America is a significantly more socialized, government spending-dependent nation (and less a free-market society) than before. But government does not create living standards - - it consumes national income. It's the private sector, not government, upon which we must depend for generating real long-term improvements of inflation-adjusted family incomes, which have barely moved in the past 2½ decades for 2-wage-earner families and have fallen for the traditional single-wage-earner family - - yet in the past most families were just fine with one wage-earner and nil debt. The private sector also depends on growing family savings with minimal household debt - instead of today's near zero savings and soaring debt.
A Warning. Federal, state and local government's expansion of its share of the economy not only reduced the free market private sector's share, it also reduced the private sector's economic surge potential previously available to win a major world war in the past. Government expansion occurred in areas not established by our founding forefather's number one reason for having a federal government, national security. We have been surprised before and may be again. (See National Security Report) Why are we passing on to our young an economy so much more dependent on government power in areas not envisioned as priorities by our nation's founders?
 #2 Core Problem: POOR EDUCATION QUALITY PERFORMANCE:
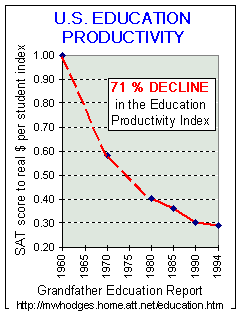
Unacceptable education quality is well documented in the Education Report chapter. Two of many graphics from that chapter are shown here.
The chart at the left, shows a 71% decline of the U.S. education productivity index. This was caused by declining quality output, coupled with huge increases in (inflation-adjusted) spending per student - - compared to our past and to foreign competitors. It is apparent improved quality does not equate to more money thrown at the current system.
This red line on the chart should have been rising instead of falling, if young families and their children are to better compete in a more technologically demanding and competitive global economy than faced by their grandparents. And, the red line also should have been rising to justify the rapid increases in spending per student. But, it fell on both counts: more spending produced lower measurable quality.
Our GOAL should be such that all are in agreement that we produce the best quality in the world - - at the best cost - - bar none. We do not. Nobel Laureate Milton Friedman: "our school quality is the worst in 35 years."
The above productivity index chart stops at 1994 because the SAT was revised in 1995 concerning content and scoring (as if someone wanted to play down declining SAT scores by changing measurement criteria, instead of fixing poor quality. That's like having a baseball team produce more home-runs by moving in the fence).
However - - we know negative performance continues from such indicators as recent results of the international math & science exam competition (we came in near last), and colleges report a decline in quality of freshman and an explosion of remedial course costs to teach basics not learned in high school (60% of freshmen in California and 70% in Florida, as examples). Recently it was reported 75% of students failed to meet reading and writing standards. Dept. Education NAEP testing of 300,000 students in all 50 states in 2005 showed 82% of 12th graders not proficient in science, worse than 10 years earlier. The problem is not lack of money (by all indications there is too much money in that system) - - it's lack of management and accountability to parents, as expected with any monopolistic system.
 While the above chart shows a
quality productivity decline trend, the left chart shows an alarming status regarding
comparative education quality with our international competitors - - yet we are faced
with the largest global economic competitive challenge in our nation's history.
This chart shows recent data. Scoring of U.S. students is the red bar in the chart. On the 2003 International Math & Science Test Series (TMSS), the AP reported, "American high school 12th graders scored near the bottom of all nations - out-performing only Cyprus and South Africa. A comparison of the high-school elite - those who took physics and advanced math - showed Americans at or tied for the bottom. 'There is no excuse for this', said President Clinton to the National Council of Jewish Woman. Asian students, which consistently outscore American students, were not included in this latest study.
More recently, data released 4 December 2007 for the OECD PISA international test series in 2006 showed U.S.A. 15 year olds came in below average, at country ranking #29 in science and rank position #35 in math.
Studies on Textbooks and math teaching methods showed 85% of middle schoolers use science text books that are significantly error-laden and unacceptable - - and that honors high school science texts are no more difficult than an eighth grade reader 50 years ago. 200 mathematicians and scientists, including four Nobel Prize recipients and two winners of the prestigious Fields Medal math prize, deplored math teaching methods, saying they are 'horrifyingly short on basics.' The international organization, OECD, called "U.S. schools mediocre at best."
Were you surprised in August 2011 that education standards are to be lowered, as U.S. Education Secretary Arne Duncan warned that 82 percent of U.S. schools could be labeled failures next year if the No Child Left Behind Law is not changed. The goal of the 2001 law is to have every student proficient in math and reading by 2014. States have been required to bring more students up to the math and reading standards each year, based on tests. The step-by-step ramping up of standards has caused heartburn in states and most school districts, because more and more schools are labeled as failures as too few of their students meet testing goals. Response planned > waive standards. http://www.cnsnews.com/news/article/duncan-states-will-get-school-testing-wa
How about grammar school performance? Answer: 'Two-thirds of U.S. fourth graders read below grade level and the weakest ones are falling further behind', according to the U.S. Education Department's reading ''Report Card'' released on 6 April 2001. Students reading at a proficient or advanced level from private schools performed 57% better than public schools. Time reports home schoolers scoring significantly above others.
Were you surprised in June 2004 when Achieve, Inc., a bipartisan, nonprofit education organization formed by governors and prominent business leaders, found that math and English tests for high school diplomas require only middle school knowledge, and those math tests measure only what students in other countries learn in the seventh grade?
Summary - - Public school quality output continues unacceptable, with less relative quality than prior generations at home and foreign students today. (this education issue is covered in graphical detail in the Grandfather Education Report - - with pictures.)
 #3 Core
Problem: INCREASED DEBT-DEPENDENCE
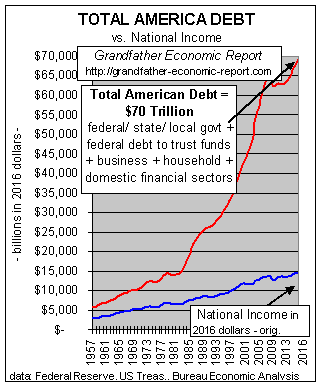
America's Total Debt (the red line) has reached $70 Trillion and, as seen in the chart, debt is increasing much faster than growth of the economy (the blue line).
America's Total Debt is here defined as the sum of all government (federal + state + local) debt plus debt of the private sector such as household debt, business debt and domestic financial sector debt. (this chart is adjusted for inflation).
Note the recent stoppage of the soaring debt (red line), as private sector debt deflated for the first time ever, assisted by record foreclosures and write-offs, while government debt soared since late 1970s, slowing down during financial crisis 2009-11, then accelarating again adding nearly an additional $10 trillion in the last 4.5 years, as the Federal Reserve tried to keep the 'debt-drug' going by acclerating federal government and business sector debt.
The left chart is one of the many in the America's Total Debt Report, proving our economy is becoming more and more debt-dependent compared to the past - - and, America's total debt is increasing more than two times faster than the entire economy's national income (can that continue?). Each dollar increase in debt produces less and less return in economic growth than ever before. (debt is like drugs, a druggie needs more and more doses to keep going.)
"I place economy among the first and most important of republican virtues, and debt as the greatest of the dangers to be feared." -Thomas Jefferson -1816.
"We hear sad complaints sometimes of merciless creditors; whilst the acts of merciless debtors are passed over in silence." - William Frend, 1817
Although most know about high debt of the federal government, few recognize an even more dangerous trend > exploding private debt ratios of family households, business and the domestic financial sectors to the highest ratios in history, coupled with nil personal savings. 4 chapters cover debt, with pictures:
 #4 Core Problem: EXPLODING INTERNATIONAL
INDEBTEDNESS
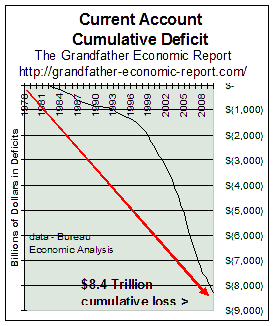
$8.4 TRILLION CUMULATIVE DEFICITS - international trade - -
In my younger years America was a creditor nation, meaning others owed us. No longer!!
America is now the greatest international debtor in world history - and getting
worse - - to the tune of $2.2 billion per day!!
This chart, from the chapter International Trade Report, gives the complete picture of America's increasing international indebtedness. It measures the U.S. cumulative international current account deficits over the past 28 years - - netting the sum of all imports and exports of goods and services, and investment flows between America and other nations.
The chart shows that cumulative deficits resulting in assets transferred to foreigners soared to $8.4 Trillion through 2010 - - which is $27,723 per man, woman and child in America.
In 2010 alone, $647 billion in additional merchandise deficits (another $2,142 per man, woman and child) were tacked on. Not a nice bequest from one generation to another.
As we purchase more from foreign nations than we produce for them, with zero domestic savings, we owe them the difference as cumulative current account debt. This chart shows America has exploded to record deep negative territory.
The chart shows that, whereas the USA used to run a balance of trade, meaning we were able to sell enough goods to other nations to pay for what we purchased from them, we are now running massive deficits. If a country runs a trade deficit, it means the country is borrowing from the rest of the world so that it can spend in excess of its production and its own savings. This means the USA is less economically competitive than before, and less independent.
For the period shown in this chart the USA debt to foreign interests totaled $8.4 trillion. Stated more simply, our children have $8.4 trillion fewer assets because we 'adults' consumed in the last 20 years in excess to that which we produced ourselves. The current account deficit represents money the U.S. has to borrow from overseas to finance spending and investment not covered by domestic production and savings.
In 1992 the U.S. current account deficit was $48 billion, which was about half the
amount spent that year on our total Medicare program.
In 2007 the current account deficit was 2 times larger than the Medicare program
(despite huge increases in Medicare spending) - - 34% more than all military spending, and
26% more than cost of the entire Social Security program.
In 2008 the U.S. had a total merchandise trade deficit of $821 billion, while Japan & Germany produced a cumulative trade surplus of $286 billion ($83+$203). That's a whopping $1 trillion worse relative trade performance for the U.S., in JUST ONE YEAR, with just 2 nations. Its not even counting that America's trade deficit with China surged 95% in the past 5 years, reaching $266 billion in 2008. Those are seriously, significant numbers.
This vividly shows how America is living beyond its means - - by consuming more production and savings of others than we produce to meet the needs of foreigners - - resulting in exploding debts payable to foreigners. The U.S. has become less competitive, despite claims of recent improved productivity (mostly realized only by a narrow part of the economy and primarily by revising how they measure productivity and inflation).
Keep in mind that foreign trade makes up 28% of the U.S. economy - - although this is mostly imports since there has been nil export growth in 25 years as the manufacturing base declined 62%.
About the past several years, it has been said: "If the US enjoys a 'new era' with higher "productivity" why has the trade deficit exploded to record levels? In an economy mostly based on "services" which very few foreigners will ever need from us, together with a shrinking manufacturing sector producing real goods, how can some so-called higher "productivity" generate the funds that will be needed to repay the debts owed foreigners who financed a trade deficit that consists mostly of "goods" produced by them and consumed by us?"
Additionally, we know from the Productivity Report chapter that much of our recent so-called productivity 'increase' came from changing how productivity and inflation (see Inflation Report) are measured and reported. Just as revising how one measures the SAT exam to pump-up the data is laid bare by how poorly our kids perform on international math exams - - so, also, is our so-called 'productivity' improvements laid bare by our disastrous trade performance.
This situation is so serious that Congress recently established the U.S. Trade Deficit Commission. Its report states the trade deficit is not only not sustainable but is danger to the nation and living standards.
Since this trend has not been corrected it spells dangerous challenges to the U.S. dollar, as a former 'king' of world reserve currencies as covered in the Foreign Exchange Report - and to American living standards. Said Dr. Allan Greenspan: "We cannot depend on imported capital, that is, a current account deficit, to offset low domestic saving indefinitely." Foreigners now own more and more of America - - about $8 trillion of U.S. financial assets, including 13% of all stocks and 24% of corporate bonds.. The Federal Government Debt Report shows they also own 49% of U.S. government Treasury bonds & notes and 14% of U.S. government agency debt (household mortgages). Additionally, they own real estate and factories. We should not be mad at foreign interests. We are the ones consuming beyond our own production, creating unprecedented debts and trade deficits.
Long-term trends of exploding deficits in our nation's current accounts and trade are covered in the International Trade Report chapter, with dramatic pictures.
NATIONAL SECURITY: In addition to threatening future freedom and living standards, each of the above 5 core challenges threaten national security - such as > > government that is too massive and controlling areas not cited by our nation's founding forefathers as their reasons for forming a federal government, poor education quality relative to our past and to other nations today, debt dependence both domestically and internationally instead of dependence on our own production and savings, and energy dependence on others instead of on ourselves. More in the National Security Report chapter.
Unprecedented and Dangerous
America faces unprecedented long-term challenges that will become greater and more dangerous - - until America restructures itself to significantly reduce its dependence on federal and state & local government and debt-based consumption, including significantly reducing debt ratios in all sectors, international trade deficits and the financial sector's share of the economy, while expanding domestic production & manufacturing, savings & debt-free asset creation ratios, energy conservation, balanced trade-only, and the buying power of the U.S. dollar as a real store of value domestically and internationally - - and, education quality and foreign reserves relative to other nations. What's your view?
Two Sobering Views
On July 1, 2008 Billionaire investor Eli Broad, 75, said "The U.S. economy is in the 'worst period' of my adult life. I worry about the future of America. It's time to regroup and redefine our place as a country and that's tough to do.''
Former Federal Reserve Chairman Paul Volcker said he "doesn't see how the U.S. can keep borrowing and consuming while letting foreign countries do all the producing. It's a recipe for American economic disaster - - a crisis is likely."
[Author note > Mr. Volcker's and Mr. Broad's worry about America's future is backed-up by each of the above data graphics, and by the depth of information contained in each chapter of this Grandfather Economic Report series.]
Above you have viewed a summary of 5 core challenges
identified by the Grandfather Economic Report series
ARE YOU SATISFIED WITH THE SITUATION ?
You have just read the Summary page out-lining 5 Core Problems identified in the Grandfather Economic Reports, a series of picture reports developed to increase awareness of difficult economic challenges facing families & youth, compared to prior generations. This summary includes just 5 of the threatening issues facing our younger generation identified by the Grandfather Economic Report series. There are others - quite a few others..
For a summary of other serious findings you may review the index of all chapters on that home page covering a graphic presentation of all issues. You can pick the subject of interest for more in-depth knowledge.- - each with dramatic color graphics proving and expanding the above summary on other subjects. Chapters include: family income, debt, savings, government spending and size, trust funds, education quality, social security, regulations, taxes, inflation, productivity, foreign trade and exchange, voter turnout, trust, celebration, national security, energy, and health care/life expectancy.
As stated on the home page >
Tribute and Feedback - - For some insight into how this report series
was born and some very kind remarks,
see the Tribute to Nobel laureate Dr. Milton Friedman.
(also, you may wish to review sample feedback from readers -- from professionals, business people, professors, teachers, parents and students, from inside America and from abroad)
Here are 5 internal links to this Summary Page, if you wish to re-review a specific
threat above:
#1 Government Dominance - - #2 Education Quality - - #3 Debt Dependence
#4 Dependence on Foreigners - - #5 Energy Threat
RETURN
TO
the Grandfather Economic Report
HOME PAGE AND CONTENTS
SEND MAIL
Send
a link to this page to others
TO THE TOP
| Home & Contents |The Path | Feedback | What's New | Link Index | Eye-opener | Must See |
Copyright © 1997-2016 Michael W. Hodges. The Grandfather Economic Report series is the intellectual property of its author; all rights reserved under Copyright Conventions. Permission to redistribute all or part of this series for non commercial purposes is granted by the author, provided the associated web page address is included and full credit given to the Grandfather Economic Report and the author, Michael Hodges. Notice appreciated via email.
 visits
this summary page since reset
3,819,132 visits direct to above chapters this series prior to counter
failure