GOAL: The best quality
in the world, without any doubt ! |
Grandfather Economic Report series
| Education Series Home & Contents
| Master Economic Report Home & Contents
|
| Summary | Feedback | What's New | Link Index | Eye-opener |
International Math &
Science Test - a sub-section of the Grandfather Education
Report - |
GOAL: The best quality
in the world, without any doubt ! |
How do U.S. students compare to other nations? Answer: Scary!
- 3 pictures tell the story - and what parents can do
This is a sub report of the Grandfather Education Report, a chapter within the Grandfather Economic Reports, a series of picture reports on various subjects showing difficult challenges facing the economic future of our young, compared to prior generations. Poor education quality is a major threat
Before you look at several pictures which will shock you, - -
Our education quality in math and the pure sciences (physics, chemistry, etc.) must improve - - by huge amounts. We are more than ever before in a global economy that is also high tech. Our young will grow up to compete for living standards and national security with more foreign students than any prior generation. The fact they score below all others in math & science could be labeled 'child abuse,' and a threat to their nation. Our goal must be the best education system in the world for math and science, bar none, and without any doubt! We are sadly lagging - way behind other nations. The OECD (Paris based Organization of Economic Cooperation & Development) said in its report, "US schools provide a mediocre education, at best." And, our nation owes more of our national assets each year to foreigners.
Before we view pictures of the U.S. ranking in education compared to other nations, let's first acquire a bit of perspective - -
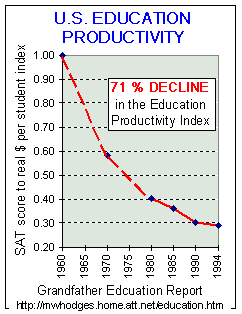 We have seen in the Education Report a trend
graphic of the education quality productivity index - - declining year after year.
There it is noted new lows were reported in SAT scores of U.S. high school seniors each
year through 1994. Each year, up until 1995, we heard on the evening news about new record
lows in test scores - - year after year. This was most upsetting to parents, and educators
were scared. Politicians vowed corrective actions. The President even called for
volunteers to help.
We have seen in the Education Report a trend
graphic of the education quality productivity index - - declining year after year.
There it is noted new lows were reported in SAT scores of U.S. high school seniors each
year through 1994. Each year, up until 1995, we heard on the evening news about new record
lows in test scores - - year after year. This was most upsetting to parents, and educators
were scared. Politicians vowed corrective actions. The President even called for
volunteers to help.
Guess What? SAT testing criteria were revised in 1995 - - making the test less rigorous than before, and test scoring methods were revised in ways unrelated to clear comparison with the past. Unhappy with being called to task for declining scores, political educators complained that the tests were unfair to some, so they watered them down - - as if 2+2=4 was being challenged as unfair on racial, gender or other social-oriented measures. Guess What? Since then the evening news no longer reported SAT results each year, as if all of a sudden all is well. Some have commented: "if you want ball players to hit more home runs, then move in the left field fence.' Or, if quality or performance results measured in 'oranges' is not nice to see, then simply change the measurement to 'apples' so you cannot compare your track record - and maybe all will be just fine.
Does revising SAT test content and scoring methods arrest declining education quality? Of course not. Not any more than moving in the 'left field fence' means we now have better quality ball players than the past. (the subject of the recent rush to change the way we measure performance of many things these days, including even economic items like inflation, GDP and productivity - - all occurring in the mid to late1990s - - is also covered in the Statistical Revisionism Report.
Although some may be 'brain-washed' to hope education quality problems have just disappeared into thin air after revising how we measure, with fewer reports on SAT scores, such cannot overshadow the proven fact we are competing poorly internationally - in fact, competing at the bottom of the heap. The International Education Report covers that subject and so in part does the page you are viewing.
The purpose of the page you are viewing is to add hard data to this unhealthy picture (with the hope such will increase awareness and aim us in a better, measurable direction for our children), - - by reviewing results of various International Math & Science Survey tests - - and see how we are doing when compared to students in other nations. Short Answer: terribly!!
After you view this page in full, check what parents can do.
2006 OECD Programme for International
Student Assessment (PISA)
Science and Math
15 year-old students - USA ranked 29th and 35th - below average
(data source released 4 December 2007 >
http://www.pisa.oecd.org/pages/0,2987,en_32252351_32235731_1_1_1_1_1,00.html)
U.S. 15 year olds ranked 29th in Science - U.S.A rank # 29
Here's a partial listing of examination rankings in the Science series.Finland was the highest-performing country on the PISA 2006 science scale. Six other high-scoring countries were: Canada, Japan and New Zealand and the partner countries/economies Hong Kong-China, Chinese Taipei and Estonia. Australia, the Netherlands, Korea, Germany, the United Kingdom, the Czech Republic, Switzerland, Austria, Belgium and Ireland, and the partner countries/economies Liechtenstein,Slovenia and Macao-China also scored above the OECD average.
Rankings first 30 nations in the Science series > Finland, Hong Kong-China, Canada, Chinese-Taipei, Estonia, Japan, New Zealand, Australia, Netherlands, Liechenstein, Korea, Slovenia, Germany, England, Czech Republic, Switzerland, Macao-China, Austria, Belgium, Ireland, Hungary, Sweden, Poland, Denmark, France, Crotia, Iceland, Latvia, U.S.A., Slovak Republic.
U.S.A. scored below avearage in the Science series, at ranking position #29.
U.S. 15 year olds ranked 35th in Mathematics - U.S.A. rank #35
Mathematics Performance > Finland and Korea, and the partners Chinese Taipei and Hong Kong-China, outperformed all other countries/economies in PISA 2006. Other countries with mean performances significantly above the OECD average were the Netherlands, Switzerland, Canada, Japan, New Zealand, Belgium, Australia, Denmark, the Czech Republic, Iceland and Austria, as well as the partner countries/economies Macao-China, Liechtenstein, Estonia and Slovenia.
U.S.A. scored well below average in the Math series, at ranking position #35, and below all industrialized nations except Italy.
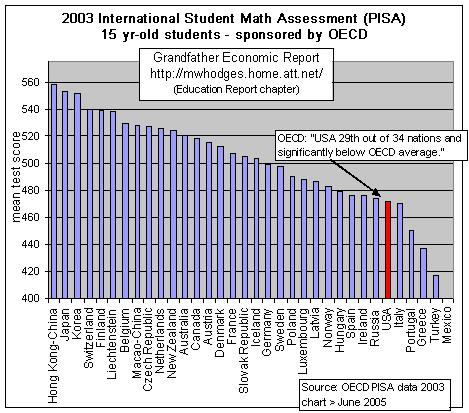
2003 OECD International Math Exam - 15 year-old students
U.S. test scores ranked 29th out of 34 nations
 OECD's Programme for
International Student Assessment (PISA) - 2003 MATH - 15 yr. old students
OECD's Programme for
International Student Assessment (PISA) - 2003 MATH - 15 yr. old students
Released late 2004 were the results of the "Programme for International Student Assessment" Math exam series for 15- year old students from over 30 nations.
This test series, abbreviated as PISA, was sponsored by the Paris-based Organization for Economic Cooperation and Development (OECD).
More than 30 nations participated, including all OECD nations plus China and Hong Kong and a few others.
The left chart shows the mean math test scores of each nation.
The USA score in the chart is in red, showing 28 nations scored higher than did 15-year old students from America. America's position in this chart is 29th out of 34 nations.
In its report the OECD cited that the United States of America's score placed it in a group called "signficantly below average."
Data published at http://www.pisa.oecd.org/
Third International Math & Science
Survey (TIMSS) - of 21 Nations
(Conducted on a four-year cycle, the
first round of TIMSS was in 1995, the second in 1999 and the third in 2003).
U.S. 12th graders at the bottom
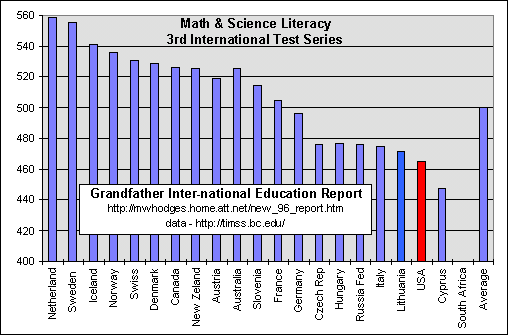 In a randomly selected subset of each country's
students, on the latest international math & science test series, the Associated Press
reported "American high school 12th graders scored near the bottom
of all nations - out-performing only Cyprus and South Africa. A comparison of the
high-school elite - those who took physics and advanced math - showed Americans at.or tied
for the bottom.
In a randomly selected subset of each country's
students, on the latest international math & science test series, the Associated Press
reported "American high school 12th graders scored near the bottom
of all nations - out-performing only Cyprus and South Africa. A comparison of the
high-school elite - those who took physics and advanced math - showed Americans at.or tied
for the bottom.
Poor U.S.A. performance occurred despite watering down the rigor of previous international tests, when we showed up so poorly, and defining the new as 'knowledge needed to function effectively in society'. Still, the results from the new test were the same, if not worse - - with US students continuing to score at or near the bottom, world-wide. As an example, even in general science sections 58% of Americans could not answer why spike heels might cause more floor damage than ordinary heels: (correct choice of several answers - more energy is concentrated in a smaller area). Only those American high school seniors who had previously taken Advanced Placement calculus and physics (college level courses) were able to even somewhat keep up with other international 12th grade students. One senior blamed her performance on switching from Catholic schools to public schools where she found herself repeating that previously learned in lower grades and with less focused instruction."
As you view these charts note the absence of Asian students from Japan, Korea, Hong Kong, Singapore - - or even China. Students from those nations did participate in the prior international test series - - - scoring at the top of the total heap. But in the 3rd test series, they opted out - - partly because of the aforementioned watered-down criteria in the new series. In the opinion of this author, had Asian students participated in this series these charts would look even worse for the U.S. - - although some might remark coming in last is still last, yet the U.S. would have been even further behind a much higher average.
From the chart above, and those following, one could term U.S. high school math and science education produces a third-world result - - just as our international debts place the U.S. as the world's greatest debtor, ever.
| In advanced math our students were tied for last place, and in physics they had
sole possession of last place.
(As mentioned above), students from Asian nations, who do very well, did not take the test this time - so American students trailed a pack of also-rans. While the American education system is falling behind academically, it is also leading the world in excuses. 1. 1. One of these excuses is that more of our students reach the 12th grade, so that we are comparing our average with the elite from other nations. While this may be true for a few nations, there are many others with as high a percentage finishing secondary school as we do, and some have a higher percentage completion rate. Both kinds of nations beat our students. 2. Another excuse is our population has so many disadvantaged minorities that this drags down our average. But when you compare our best with those of other countries, ours still get clobbered. |
| Below are the results of the Advanced Math test, as discussed above.
'While many of our schools appear to avoid solid academic training in favor of 'self-esteem' training, this must be working since in the latest round of international tests American students led the world in one department: 'self-esteem.' As in previous international tests, American students had the highest perception of how well they had done. 70% said they thought they had done well. This would be comic if it were not so tragic. While there are many particular things that can be criticized in our public schools, many critics often miss the point when they fail to see that the key to all these counterproductive policies are the people who make them. If we purged our public schools of all the silliness there today, we would have accomplished little if the same kinds of people were left in place to bring in new non-academic nonsense tomorrow. Raising teacher salaries will not fix it.' (Professor Thomas Sowell). William Schmidt of Michigan State University said, 'for sometime now, Americans have comforted themselves when confronted with such bad news about their education system by believing that our better students compare favorably with the better students in other nations - but, this test bursts another myth.' There is no excuse for this', said President Clinton to the National Council of Jewish Woman. Asian students, which consistently outscore American students, were not included in this latest study. (published 2/25/98 Sarasota Herald Tribune) |
December 2000 - Third Annual International Exam (TIMSS-R)
- 8th graders
- our 8th graders' lag the best, with no improvement over prior tests -
The TIMSS was based on
a random selection from each nation
"TIMSS was a study which was based on a randomly selected subset of each country's students. It didn't exclude (those who later become) teachers or any other major, or any other sex, race, economic status, ethnic background, etc. In the US, it is an accurate reflection of our performance (plus or minus 3%) relative to other countries, and it showed that we ranked 19th out of 21 countries. You cannot say that our teachers don't score low when the labor pool from which they are selected scored at the bottom of the heap (and this didn't even include 5 Asian countries which blew us away at the 8th grade level)." 2/20/01 by Jim Knight, johnknight@pmail.net - posted to newsgroups: alt.education and misc.education
- Swiss vs. American Students -
4 to 1 understanding and applying math principles
Technical Brain Drain - fewer, and fewer U.S. citizens take technical graduate courses
According to the National Science Foundation, enrollment of science and engineering graduate students declined 1993-98, but in 1999 showed a minor up-tick in foreign grad students on temporary visas while the numbers for U.S. citizens declined again. Foreign students on temporary visas are less likely to stay in the U.S. and contribute to the economy. Source: Business Week, March 5, 2001, pg. 30.
So - - the technical 'brain drain' in the U.S. continues
check what parents can do
Nov. 1996 Report - 2nd International test Evaluation of 41 Nations
For tracking data on how we are doing internationally, the authors of The Grandfather Education Main Report, and its companion the Grandfather International Education Report, have used various arms-length data sources - such as the 1995 Digest of Education Statistics from DOE. (the later test series was reported above).
In November 1996, The Washington Post reported: <<More than a half-million students from 41 countries participated in the study, including about 11,000 American students, from 180 public and private schools nationwide)>>.
(author note: I wonder if there is a mistake in the newspaper reports that only 11,000 were Americans out of half-million taking the test world-wide. And, 11,000 out of 50 million total US students is a pretty poor sample. It is quite possible the U.S. was trying to be selective in picking its participants - - although the results were still terrible. Every parent should demand that their school district have every senior take this test series. Why are they not doing so? Shirking accountability? Here are several extracts copied exactly from a summary in the press resulting from the DOE briefing, for those who might have missed them.)
Said the Washington Post, <<The largest international study ever undertaken of how American students perform in math and science shows their work lags behind many other nations. Its findings, just released, bluntly suggest that there are core problems with the teaching style and the courses that many American schools rely on to instruct students in math and science. Researchers said they organized the new evaluation because past studies that have compared students internationally only by using test scores have been dismissed by some educators as incomplete and overstated.>>
(author note: Suggest the reader re-read the last sentence above, to get the 'feel' how 'some educators' try to justify poor performance by revising how one scores. The prior international test series, recorded in the 1995 Education Digest and summarized in the Grandfather International Education Report, showed a dismal result for the U.S. compared to other nations - just as our SAT scores show dismal result compared to prior generations. As is too often the case, when one is behind, special interest groups like to change the scoring methods for future comparisons. We have seen this approach used in significantly dumbing-down SAT tests by making the test easier (less vocabulary, less algebra & geometry, use of calculators, test methods, 'teaching to the test,' etc.), yet even with that easier test current SAT scores still lag way behind those of prior generations who took the more rigorous test series. This 'revising the measurement standard' approach appears to have been considered also for this international series just completed, and it is unfortunate as it has the appearance of attempts to 'cover-up' accountability and the need for major restructuring of our education quality delivery system. It is encouraging from the recent press reports that our top leaders at DOE appear to have their eyes wide open and are not fooled with the US showing in the latest series, even with the less rigorous scoring methods compared to the past, as this means to me that they are 'reading between the lines' and will not accept a line of 'no action needed.' At least we must hope they take effective action (although, as the reader saw from the charts at the top of this report for the more recent test, our performance is worse than before). We must use clean test scores; dismissing test scores can lead to questions about the value of any national rankings in this new study. Further, such approaches will not cause the respected international organization, OECD, to retract its statement that 'U.S. schools provide a mediocre education, at best.' But, even 'playing' with the scoring methods, the Washington Post summary of what top education officials had to say in Nov. 1996 after they read the results of that international report are most sobering, indeed. And those 'some educators' are not off the hook and some jobs should be on the line, especially since our public school spending per student is higher than other nations, and higher than the average private school in the U.S. There is clear evidence that there is zero correlation between spending and quality achieved).
<<Education Secretary Richard W. Riley said in a statement to The Post, "The issues are much deeper -- the content and rigor of what we are teaching -- how we go about teaching. The study raises new questions about how American students are being taught math and science at a time when schools nationwide are trying to put more emphasis on the subjects and demand more rigor.>>
<<Business leaders, worried about the nation's competitive status in a global economy, are pressuring. American math teachers cited "uninterested students" as limiting their teaching much more than teachers in either Germany or Japan. Findings suggest that our students receive a less-advanced curriculum, which is also less focused. The content in most eighth-grade math classes in the United States, researchers found, resembles the seventh-grade math curriculum in most of the other nations that were studied.>>
(author note: re-read the last sentence. They are saying the content in an 8th grade class resembles a 7th grade class in other nations. What is even worse, is that even our 7th grade content in an 8th grade class does not mean that our 8th graders are actually learning as much of that content as younger foreign students - - given the statement that our courses are less focused and that students are less interested in learning, as reported in The Post. Coupled together, this suggests our math learning lags significantly by class and age group. Learning is the key, to strict and high measurable standards.)
The press continues, <<One of the clear messages of this report is we need to take a good, hard look at what we teach and how we teach math," Riley said. Most nations have a national curriculum in math and science; the United States does not. Said Deputy Education Secretary Marshall S. Smith, "The message of this study is still very clear: We're not teaching the same content as many other nations, and our teachers are not doing enough of what experts in these fields say they should be doing.">>
Were you surprised in June 2004 when Achieve, Inc., a bipartisan, nonprofit education organization formed by governors and prominent business leaders, found that math and English tests for high school diplomas require only middle school knowledge, and that those math graduation tests measure only what students in other countries learn in the seventh grade? - - should we care? http://www.stateline.org/stateline/?pa=story&sa=showStoryInfo&id=377921
(author note: not only do we not have clean standards, but as reported above we are dumbing down those we have. How could the private sector survive without clear standards of quality measurement with rejection of poor quality wherever encountered - - less the entire enterprise be subject to failure? How dare we expect less from our education system? See also, Inflated Grading Standards Short-change Parents and students)
The authors of the Grandfather Education Reports hope this presentation will serve a useful purpose in highlighting to others our education quality problem, compared to other nations. In a way, the trends in education quality in the country, relative to foreign students, some what mirrors our negative trend lines in trade as shown in the International Trade Report.
Of special interest, looking forward to the results of future international tests will be what if any testing and ranking criteria will be revised? We must watch out for redefinition of what is called 'science'. It must mean only the hard, pure natural sciences of physics & chemistry - instead of diluting this category with a mix of computer and environmental sciences. Also we must be sure math stands alone as pure math (incl. Algebra, geometry, calculus) unmixed with other subjects, such as computers. To get a proper perspective it is most important that testing and ranking criteria not be revised compared to past criteria, or if it is revised that the new scoring is reported by both old and new methods for all to see.
check what parents can do
SOME DEFINITIVE RESULTS Dr. William Schmidt, the National Project Coordinator for the 3rd International Math & Science Study reported in newsgroup: k12.ed.math |
| Gary Scott Simon <garscosi@pipeline.com> wrote in article
"Via C-SPAN, I saw Dr. William Schmidt, the National Project Coordinator for the 3rd International Math & Science Study, give an address at American University on February 19th. Much of his text came as no surprise. American students lag behind students from other industrialized nations. American classes address more different topics, and devote far less effort to drawing connections between topics. Dr. Schmidt spoke passionately about the fractured, splintered nature of American math education and the resulting impression many students receive that math involves "hundreds of things to learn". He also warned that many calls to get "back to basics" often miss the point entirely, by asking students to work harder without helping them to work any smarter. I hope parents, teachers and citizens in general will heed Dr. Schmidt's call for more teaching of mathematical thought, and less isolated computational practice of isolated skills." Gary, Thanks for your informative posting. Understand this round of international tests saw U.S. 8th graders come in behind 27 other nations in math, despite the lowering of certain hard measurements as done in the prior series. Hopefully, the more the subject is discussed the better the chance for our youngsters - - although I have yet to see any major system change in that direction. For those interested, there are several pictures of various quality trends RE The International Education Report at https://grandfather-economic-report.com/education-c.htm Michael Hodges |
Additional shocking news >
Each parent with school-age children should demand of their local school board that every 8th grader and senior must be required to take the International Math & Science Survey (IMSS) test each year, with the results published to parents of the individual results and ranking with both the national average AND with all other nations. Additionally, even though the SAT has been watered down compared to the past, parents must demand an annual publication from their school district showing the more recent SAT scores in math and verbal for each school, and also showing it in comparison with a trend graphic of said results over the past 15 years. If a school system does not meet this demand, then parents should remove their children from the district - - and seek schools that do so and which also show an improving trend each year. No other test data should be used instead of the International test series and SATs.
Schools can activate their system with the international test series by contacting their State's Department of Education AND the Federal Dept. of Education - - as well as the TIMSS at http://timss.bc.edu/
For those who question the fairness and accuracy of the international test series see proof by Pascal D. Forgione, Jr., Ph.D. U.S. Commissioner of Education Statistics at http://4brevard.com/choice/international-test-scores.htm
Return to Education Report - page 1- table of contents
OR - International Education Report
OR - The Textbook Report - - showing how error-laden science books and improper math teaching methods relate.
OR - Comments about quality problems by Teachers, Students & Parents
OR - Reduction of college standards for admission and required courses
and - International Trade Report - - showing deteriorating conditions economically to new records.
TO HOME PAGE of Grandfather Economic Reports - for a complete listing of all the grandfather reports: family incomes, debt, foreign trade, inflation, social security, government spending at federal & state & local levels, productivity, regulation costs, foreign exchange, health care, voter turnout, and education quality - - compared to prior generations.
Michael Hodges - Email
| Education Series Home & Contents | Master Economic Report Home & Contents | Summary | Feedback | What's New | Link Index | Eye-opener |

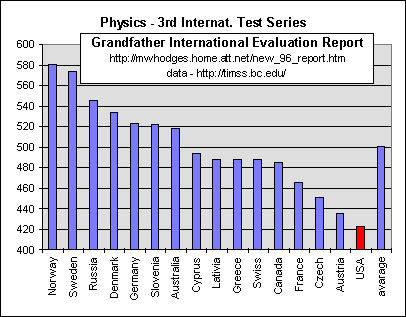 Here are the
Physics results, with USA's ranking shown in RED.
Here are the
Physics results, with USA's ranking shown in RED.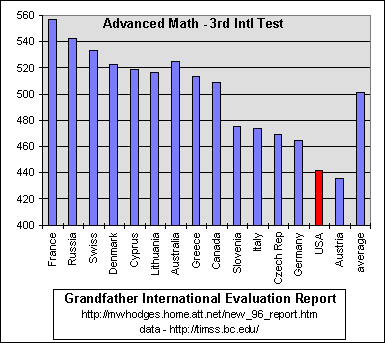 U.S. Secretary of Education Richard Riley has responded to the
sad results from these international tests by calling them 'unacceptable.'
U.S. Secretary of Education Richard Riley has responded to the
sad results from these international tests by calling them 'unacceptable.'