
Grandfather Economic
Report series
| Home & Contents
| Summary | Feedback | What's New | Link Index | Must See | Email
PRESIDENTIAL ELECTION 2004 |
The Grandfather Economic Reports is a series of picture reports of threats to the economic future of families and their children, compared to prior generations. You are now at the brief chapter on Public Voting in the 2004 Presidential national election. Welcome. We hope your visit will find useful information to help you and your loved ones. (see report at https://grandfather-economic-report.com/ ).
Presidential Election Results by State and by County
- count as of December 5, 2004 -
A president is elected by 538 electoral college voters, the 538 representing the total number of U.S. senators (100) and congressional house members (438). Each state is granted the number of electoral votes equivalent to its 2 senators plus the number of its congressional house members; Washington, D.C. is granted 3 electoral votes. To win the presidency a candidate must receive a majority, meaning at least 270 electoral votes.
In 2000 > Mr. Bush barely won the presidency with 271 electoral votes, although he
narrowly lost the popular vote.
In 2004 > with a much larger voter turn-out, Mr. bush won the presidency much more
decisively in electoral votes and popular votes.
2004 PRESIDENTIAL ELECTION RESULT BY STATE
 George W. Bush won the 2004
presidential election, with 286 electoral votes of the required 270. (in the 2000
election he won 271 electoral votes).
George W. Bush won the 2004
presidential election, with 286 electoral votes of the required 270. (in the 2000
election he won 271 electoral votes).
This map shows that vote by state.
The red states represent those won by George Bush; the blue states by John Kerry.
Bush won 31 states and 50.73% of the popular vote nation-wide.
Senator Kerry won 19 states plus Washington, D.C. with 252 electoral votes, and 48.27% of the popular vote.
The popular vote total for Mr. Bush of 62,040,610 was the highest popular vote for any U.S. president in history. Challenger John Kerry had 59,028,444 votes.
The winning vote margin for Mr. Bush was 3,012,166. (in the 2000 election Mr. Bush lost the popular vote although he won the election).
The total Bush-Kerry voter turn-out was 121.1 million. This 2004 turnout was 14.9% higher than the 2000 election year turnout of 105.4 million.
 2004 ELECTION RESULT BY COUNTY
The counties colored red were won by George Bush.
Those counties colored blue were won by John Kerry.
Of the approx. 3 million square miles of area represented by the red and blue colored counties, 2.5 million sq. miles were won by George Bush - - approximate 84% of the total.
In the prior election in 2000, Mr. Bush won 78% of the square miles.
2004 ELECTION DATA BY STATE
Bush
Pop. Vote % |
Kerry
Pop. Vote % |
Electoral
Votes |
Winner |
|
63% |
37% |
9 |
Bush |
|
62% |
35% |
3 |
Bush |
|
55% |
44% |
10 |
Bush |
|
54% |
45% |
6 |
Bush |
|
44% |
54% |
55 |
Kerry |
|
52% |
47% |
9 |
Bush |
|
44% |
54% |
7 |
Kerry |
|
46% |
53% |
3 |
Kerry |
|
52% |
47% |
27 |
Bush |
|
58% |
41% |
15 |
Bush |
|
45% |
54% |
4 |
Kerry |
|
68% |
30% |
4 |
Bush |
|
45% |
55% |
21 |
Kerry |
|
60% |
39% |
11 |
Bush |
|
50% |
49% |
7 |
Bush |
|
62% |
36% |
6 |
Bush |
|
60% |
40% |
8 |
Bush |
|
57% |
42% |
9 |
Bush |
|
45% |
53% |
4 |
Kerry |
|
43% |
56% |
10 |
Kerry |
|
37% |
62% |
12 |
Kerry |
|
48% |
51% |
17 |
Kerry |
|
48% |
51% |
10 |
Kerry |
|
60% |
40% |
6 |
Bush |
|
53% |
46% |
11 |
Bush |
|
59% |
39% |
3 |
Bush |
|
66% |
33% |
5 |
Bush |
|
50% |
48% |
5 |
Bush |
|
49% |
50% |
4 |
Kerry |
|
46% |
53% |
15 |
Kerry |
|
50% |
49% |
5 |
Bush |
|
40% |
58% |
31 |
Kerry |
|
56% |
44% |
15 |
Bush |
|
63% |
35% |
3 |
Bush |
|
51% |
49% |
20 |
Bush |
|
66% |
34% |
7 |
Bush |
|
48% |
51% |
7 |
Kerry |
|
49% |
51% |
21 |
Kerry |
|
39% |
60% |
4 |
Kerry |
|
58% |
41% |
8 |
Bush |
|
60% |
38% |
3 |
Bush |
|
57% |
42% |
11 |
Bush |
|
61% |
38% |
34 |
Bush |
|
71% |
26% |
5 |
Bush |
|
39% |
59% |
3 |
Kerry |
|
54% |
45% |
13 |
Bush |
|
46% |
53% |
11 |
Kerry |
|
9% |
90% |
3 |
Kerry |
|
56% |
43% |
5 |
Bush |
|
49% |
50% |
10 |
Kerry |
|
69% |
29% |
3 |
Bush |
Note - thanks to Yahoo.com for some of above data.
Vote margin of victory - - Bush vs. Kerry
The winning margin for Mr. Bush was 3,012,166 more popular votes than Senator Kerry.
Comparing 2004 with 2000 > in 2004 Bush won two states (Iowa and New Mexico) totaling 12 electoral votes that he did not win in 2000, but in 2004 he failed to win New Hampshire (4 electoral votes) which he won in 2000. Bush's popular vote in 2004 of 62,040,610, was a huge 23% (11,584,608) votes more than the 50,456,002 he won in the 2000 election. To view comparative pictures for the 2000 Election, see PRESIDENTIAL ELECTION 2000 REPORT
The 2004 electoral map, broken down by counties, showed Kerry's support to be concentrated in urban areas on the two coasts and the upper midwest, and Bush's to repose in the rest of the country. Bush defeated Kerry by 57 to 42 percent in small towns and rural areas, and by 52 to 47 percent in the suburbs. In contrast, Kerry won cities with more than 50,000 people by 54 to 45 percent.
An interactive map demonstrating margin of victory, for those interested in a bit more detail. Note: in that graph Bush is red and Kerry is blue, and the picture is a bit slow to load. (if necessary, click the tab called '2004'.
2004 SPENDING > Dow Jones reported 31 October: “The most expensive presidential advertising campaign in history closes after eight months with President Bush, Sen. John Kerry, their political parties and allied groups having spent more than $600 million. That’s triple the amount spent on TV and radio commercials in 2000.” It was also reported that losing candidate (Kerry) spent more than winning candidate (Bush).
2004 FLORIDA ELECTION
Florida is high-lighted in this presentation since it was such a pivotal state in both the 2004 and the 2000 elections.
Whereas Florida's voting was extremely close and contentious in 2000 and narrowly won by Mr. Bush with a margin of just 537 votes, as shown in the table above the Florida vote for 2004 was hugely decisive, with 52% of its popular vote won by Mr. Bush vs. 47% for Senator Kerry.
The Florida 2004 vote for Mr. Bush was 3,964,522, or 380,978 more votes than Senator Kerry's 3,583,544.
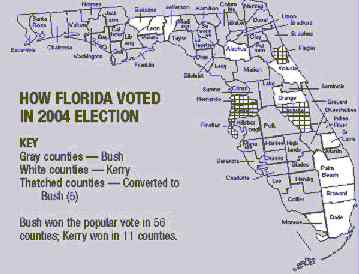 Of the 67 counties in Florida, Mr. Bush won 56
(84%); in the 2000 election he won 51 counties (76%).
Of the 67 counties in Florida, Mr. Bush won 56
(84%); in the 2000 election he won 51 counties (76%).
This map shows the 11 counties won by Senator Kerry (white color). Mr. Bush won the 51 gray-colored counties in both 2004 and 2000 plus won the 5 thatch-colored counties in 2004. Graphic from Longboat Key Observer.
The total Florida vote in 2004 was 7.6 million, 31% turnout more than the 5.8 million votes cast in the 2000 election.
The Nader factor > Many claimed prior to the election that having Mr. Nader on the ballot would threaten Senator Kerry's chances of winning. In fact the Democratic Party worked hard in some states to keep Mr. Nader off the ballot. However, the facts for 2004 show that Challenger Ralph Nader won just 32,890 votes in Florida - - a total which if added to Senator Kerry's total vote still would not have come anywhere near Mr. Bush's combined 348,088 vote margin over both Kerry and Nadar. Mr. Nadar was not on the ballot in another 'battle-ground state', Ohio, which was won by Mr. Bush by 118,601 votes.
KEEP IN MIND
In 2004 - although 122.3 million citizens voted, 93.4 million (43%) voting-age citizens DID NOT vote.
To view comparative pictures for the 2000 Election, see PRESIDENTIAL ELECTION 2000 REPORT
To view historic trends of voter turnout prior to 2004 election, see VOTER TURN-OUT REPORT
SOME HUMOR
NOW - how about a joke about elections, to add some humor for a change. Do you recall
the 2000 election that was down to the wire, depending on recount after recount in
Florida, together with court case after court case?
Question: What is the real reason in November & December 2000 voters in Florida delayed that
Presidential election ?? Read and know the 'facts.'
Return to the home page of the Grandfather Economic Reports at
https://grandfather-economic-report.com/
Email Michael Hodges
| Home & Contents | Summary | 12 Questions | Feedback | What's New | Link Index | Eye-opener | Must See |
Copyright © 2004-2010 Michael W. Hodges. The Grandfather Economic Report series is the intellectual property of its author; all rights reserved under Copyright Conventions. Permission to redistribute all or part of this series for non commercial purposes is granted by the author, provided the associated web page address is included and full credit given to the Grandfather Economic Report and the author, Michael Hodges. Notice appreciated via email.