Grandfather Economic Report series

HOME - Florida Report - Florida summary - E-mail author - Grandfather Economic Report

Florida Government Spending Report

FLORIDA STATE & LOCAL GOVERNMENT
SPENDING SECTION

by Michael Hodges
- notice > updated March 2004 -

- a chapter of the Grandfather Economic Reports -


SUMMARY: $31 to $57 billion too much spending

The following charts show Florida state & local government gobbling up more and more of the private sector's share of the State economy - - and, thereby transferring more control of the state's economy to government - - and, away from the free-market private sector. Spending ratios to economy size are more than 3 times larger than prior to 1950, as approximately 13% of the state's economy has been transferred to state & local government dependence.

This has accelerated in recent years, during a period when nation-wide real median family incomes and savings rates have stagnated and fallen.

These charts suggest the Florida Legislature has its work cut out if it wants to improve the State's economy for future generations. It must not only act to reduce state direct spending ratios to economy size, but also take action to encourage a reduction in local government spending ratios, as a large portion of the latter is represented by state appropriations & transfers. If the State over-appropriates and transfers to local government you can be sure it will be spent.

The historic trend charts below 'cry-out' for a return (from state & local government) of at least 8% of gross state product to the private sector.

Let's take a look at some long-term trends


FLORIDA STATE + LOCAL GOVERNMENT DIRECT SPENDING TRENDS

CONSUMING 7% TOO MUCH OF THE ECONOMY - $31 BILLION (61%) TOO MUCH

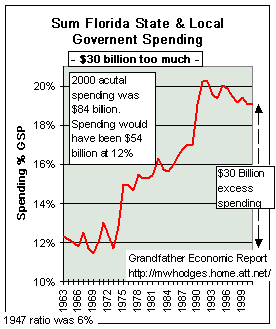
Florida state + local spending trendsThe chart at left plots 1963-2000 trends of total Florida state & local government spending, as a share of the state's economy (gross state product).

Spending has risen much faster than the economy - from 12% of gross state product (GSP) in 1974 to 19%.

Had 2000 spending remained close to 12% of GSP, then 200 spending would have been $31.4 Billion less. The excess is $31.4 billion.

This means a 61% excess compared to prior spending ratios.

This increase in government, consuming an additional 7% share of the economy, came from an effective reduction in the private sector's share of the state's economy.

A 37% total spending cut would be required to re-acquire ratios close to 12% of GSP of the mid 1960s - - which in turn is double the estimated 6% ratio of the late 1940s.

For the period 1947-63 it is estimated an additional 6% of the economy was transferred to government, assuming Florida's 1947 ratio was similar to national averages at that time. Had 2000 spending been at the 6% GSP ratio, said spending would have been a whopping $57 Billion LESS (it would have been about $27 billion in total for state & local, not the $84 billion realized).


The above chart shows the totals of Florida state direct spending and local government spending in relation to the size of the economy.

The following two (2) charts break down these trends in state vs. local government direct spending.

STATE GOVERNMENT DIRECT SPENDING TRENDS

consuming 3% more of the economy than should be - - $12 billion, or 75% too much

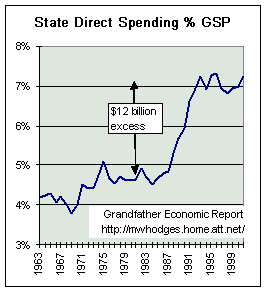
state spending ratiosLeft chart shows direct spending at the Florida state government level, as a share of Florida's economy, 1963-2000. (excludes double counting of transfers to local govt.)
2000 direct state spending was $30.9 billion, or 7% of gross state product (GSP). This compares to a 4% spending ratio in prior years, shown on the left of the chart.

A pronounced upward trend in mid 1960s, then accelerating from mid 1980s. From 1963-2000 such spending increased 75% faster than the economy, thereby reducing the share of the economy remaining to the private sector by that amount.

If 2000 state spending had been at 4% GSP it would have been $17.7 billion, not the $30.9 billion that did occur. Therefore, the 2000 state spending excess is $12.2 billion - - 69% too much.

This chart shows 2000 state direct was 7% GSP - - near another ALL-TIME historic HIGH.

A 39% spending reduction would be required to re-acquire a spending ratio of 4% of GSP.

Note: keep in mind this chart is for direct spending at state level, and is not appropriations.

LOCAL GOVERNMENT DIRECT SPENDING TRENDS

consuming 5% to much of the economy - - 66% too much equal to $19 Billion excess

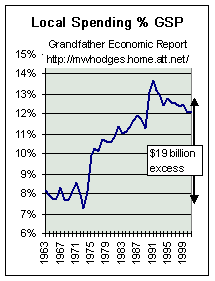
local spending ratiosLeft chart shows spending at the Florida local government level, as a share of Florida's economy, 1963-2000.
2000 Florida local government spending was $53.4 billion, or 12.1% of gross state product (GSP). This compares to a 7.7% spending ratio in prior years, shown on the left of the chart.

A pronounced upward trend in mid 1970s, then accelerating from mid 1980s. From 1963-2000 such spending increased 50% faster than the economy, thereby reducing the share of the economy remaining to the private sector by that amount.

If  2000 local government spending had been at 7.7% GSP it would have been $34.1 billion, not the $53.4 billion that did occur. Therefore, the 2000 state spending excess is $19.2 billion - - 56% too much.

A 36% spending reduction would be required to re-acquire a spending ratio of 7.7% of GSP.

As a note, the start of the dramatic rise in 1974 coincides with the stoppage of prior increases in real median family incomes - - as if hitting a brick wall.

While its encouraging to note a slight drop in the late 1990s of the spending ratio, we are still missing that $19 billion.

A 38% spending reduction would be required to re-acquire prior 7.7% ratio - - some of which is state responsibility via appropriations/transfer ratio reductions.

This rapid expansion started at same time nation-wide family incomes stopped growing - after decades of improvement before

How about more recently? Well - - in the 14 years 1986-2000 for which we collected population data >


SPENDING COMPARED TO PERSONAL INCOME IS $20.1 BILLION (31%) TOO MUCH

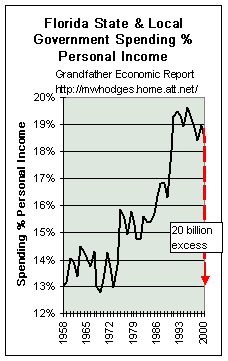
trend spending-personal income ratioThis chart compares the sum of state & local government spending as a percentage of state personal income, instead of to GSP as above 1958 to 2000.
Its track and trend is similar to the above charts which are related to GSP, instead of personal income.

In this chart, had state and local government spending in Florida NOT increased faster than the state's personal income, then the left chart would show a flat, horizontal data plot. Had Florida governments during that period produced productivity improvements then the chart would show a declining data plot.

But - what do we have? Answer: a rapidly rising data plot - - meaning government spend much, much faster than growth of personal incomes.

For the 17 years 1958-1975 the spending ratio was 13-14% of personal income, as seen on the chart.

It can be noted that the last 2 decades produced dramatic increases in this spending ratio, as spending increased much, much faster than state personal income since 1975.

If 2000 spending had been at the 13% ratio, then 2000 total spending would have been $64 billion instead of the $84 billion that occurred - - meaning an excess of $20.1 billion.

The chart shows that the late 1990s experienced a spending situation whereby the spending ratio did not increase, for the first time in 25 years. While that is commendable, - -

- -  2000 spending was still 31% too much when comparing to personal income growth.


SUMMARY: spending therefore, is $20-30 Billion too much, depending on whether you compare to Gross State Product or to State Personal Incomes - - or 31-61% too much.

This excess is based on zero productivity increase in state & local government efficiency of operations during the past 40 years. Had we required just moderate efficiency increases of about 2% per year, it can be said total spending in 2000 was about $40 billion too much - - or, nearly twice what it should have been.

By the way: 2000 total state & local spending of $84.2 Billion compared to the population of 16 million that year equates to nearly $5,263 per man, woman and child in the state's population in 2000.

Are such trends of more government, and less free-market private sector, proper for enhancing economic achievement and freedom for young families and future generations, compared to prior generations? I thought our founding fore-fathers envisioned a very small government sector. Why must ours be so large in peace-time?

BOTTOM-LINE: $30 BILLION (55%) EXCESS SPENDING 2000

Looking at the charts above (1963-93), it can be determined that target spending ratios to Gross State Product achieved in prior years should be 4% for state direct spending, 7.7% local government, and 11.7% total. 1993 data has become available from the Census Bureau showing a 20% ratio, and the following table computes impacts:

Excess spending 2000 vs. target year ratios
 

state

local

total (sum)

target ratio GSP 4.0% 7.7% 11.7%
2000 ratio GSP 7.0% 12.1% 19.1%
2000 was ($ bill) $30.9 $53.4 $84.3
should be ($ bill) $17.7 $34.1 $51.8
excess > ($ bill) $ 12.2 $19.2 $31.4
% excess 69% 56% 61%
cut % need 39% 36% 37%

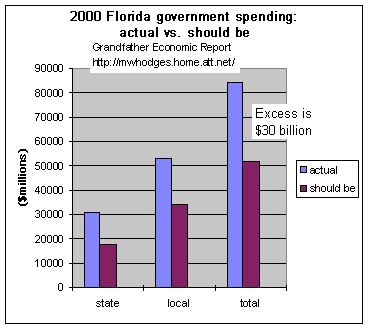
This table shows spending ratios to Gross State Product achieved in the past (the target ratios) of 4% State, 7.7% local government with 11.7% total - - compared to a total in 2000 of 19.1% of the economy as seen in above charts.


SUMMARY CHART 1993 EXCESS SPENDING of $23 Billion

Excess spending amounts The left chart shows excess direct spending in the past 2 decades, represented by yellow bars - $9 billion state, $14 billion local, and $23 billion total

State spending was $30.9 billion shown by the first blue bar - it should not have exceeded the brown bar of $17.7 billion - creating a $12.2 billion excess.

The middle group is for local government spending: $53.4 billion actual (blue bar)  vs. should not exceed $34.1 billion (brown bar) - creating excess of $19.2 billion.

The last group of bars to the right is the sum state & local: $84.3 billion actual (blue bar) vs. should not exceed $51.8 billion (brown bar), for a $31.4 billion excess.

A combined state and local government spending cut of 37% is indicated, equivalent to a cut of $31.4 billion Breaking it down to 39% ($12.2 Billion) cut in direct spending at state level and $19.2 billion (36%) at local government levels - - is required to re-acquire prior ratios.

Surely there are apologists with 'justifications' for larger and larger chunks of the Florida economy being made dependent on state & local government spending, compared to 25 years ago - - with a smaller pure- free market private sector than before. It must be kept in mind that we are not talking about spending justifications, these charts compare spending to the size of the economy. They are ratios, that do not need inflation adjusting.

Some may blame part of the problem on education spending, although Florida may follow the national trends in huge real increases in per student spending - - with no improvement in measurable required quality, compared to prior generations - - as documented in the Grandfather Education Report (https://grandfather-economic-report.com/education.htm). Further, according to the Legislature's demographic research unit, those age 19 and under in 1980 represented but 27% of the population vs. 25% in 1990 - and, the 25% ratio is project to hold steady into the future. So, spending increases cannot be justified by higher education quality, and the youth share of the population is leveling out.

Others will cite environmental actions, without specifying the further impacts on the private sector of its regulatory compliance costs, compared to the past - - as documented in the Regulation Report (https://grandfather-economic-report.com/regulation.htm ).

But, when all is said and done, the bottom line is that today's young working families are carrying on each of their backs a much, much larger government load than ever before - - with little to show for the sacrifice and strain. Living standards have not advanced, rates of savings are at historic lows, and family debt payments percent disposable income are at historic highs - - nation-wide - - as covered in the Family Income Report and the America's Total Debt Report or Federal Government Debt Report. It is doubtful our nations' founding fathers could have envisioned such a dominance by government entities - - they intended limited government control. However it is called, Florida' economy has become significantly more socialistic, and less free-market as a result of excess state & local spending ratios, compared to the past. And, this is an in-equitable load, compared to prior generations.

A strategic plan to reverse these trends (aiming at the targets) is suggested - - with consideration to privatize major portions of Florida governments - - at all levels.

The reader is now directed to view the trends of government employees at state and local levels, in the Florida Government Employee Report - with dramatic trend charts.

EMAIL author

GO TO TOP