Trends of Florida Appropriations at State Level |
|
 |
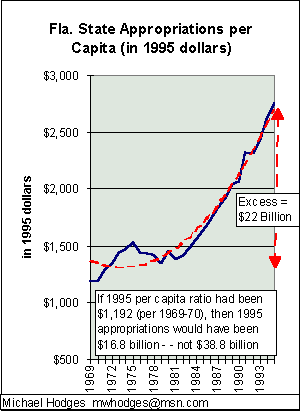
The left chart shows 1969-95 Florida's State government spending appropriations on a
per capita basis (in 1995 dollars). Note the trend: from $1,192 per capita 1969-70, rising 20% to the $1,350 level 1971-81, and then ZOOMING up and up. 1995 was $2,755, meaning it consumed 131% more per person in constant dollars than in 1969. If 1995 actual appropriations had been at the same per capita ratio as 1969-70, then 1995 appropriations would have been $16.8 Billion - - not the $38.8 Billion reported in 'Florida's Final Budget Report' from the Governor's Office. The indicated excess for 1995 was, therefore, $22 Billion - or nearly $1,600 per person too much !! This would require a 57% cut to return to prior ratios. |
 |
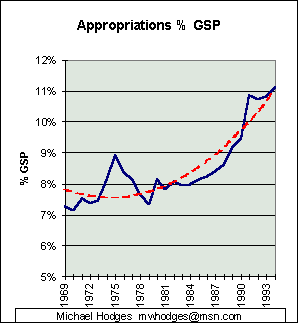
The left chart looks at appropriation trends from a different perspective - - as a
share of Florida' economy, as a ratio to Gross State Product (GSP). As will be
seen, no matter how one observes historic trends - - they appear most disturbing. From 7.2% GSP in 1969, appropriations have increased dramatically faster than the economy since 1984 to 11.1% in 1994. In 1994, the State appropriated 54% more of the total economic share than in 1969. In just the past 10 years, the increase was 40% more. So, of the total increase in consumption of the economy in the past 25 years, 74% of this occurred in the recent past 10 years since 1984. The red-dash line is the polynomial trend line. |
 |
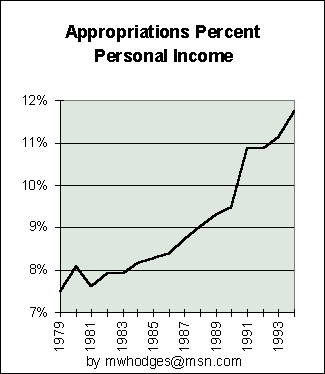
Another view is shown by the left chart Florida appropriations percent Personal Income, 1979-94, using census data. This chart reflects a similar accelerating upward trend from 1979 forward, as did the
prior charts. The three charts show dramatic problem trends, whether related to inflation-adjusted per capita, to gross state product, or to personal incomes. The economy, no matter the measure, is simply being overwhelmed by government dominance, compared to the past. It should be noted, that were appropriations data available prior to 1969, the trends noted in these charts would appear even more dramatic, compared to prior generations. |
| The above charts clearly show the Florida state government has been
increasing appropriations at a much faster pace than the growth in the state's economy
- - thereby depressing the share of the economy remaining for the productive,
free-enterprise private sector. As government controls more and more of the economy, said
economy has become less a free-market economy - - and, more a socialistic one - -
than before. Was such a trend envisioned by our founding fore-fathers? Is this best for the economic well-being of our young generation, compared to before? For those who believe that freedom and living standards are better served by a free-market economy with minimal government, these trends are disturbing. |
|
| This page covers historic Florida State appropriations data. It reflects dangerous trends and levels of appropriations, compared to the past. As mentioned at the beginning of this page, appropriations is not as good a measure as direct spending at the state and local levels, but is provided here for information. The reader is now directed back to the important section Spending Report and Charts - the meat, and following that to a look at headcount trends. | |