Grandfather Economic Report series
| Home &
Contents | Summary | Feedback
| What's New | Eye-opener
| Must See |
This is page 2 of the Family Income Report, of the Grandfather Economic Report series,
comparing trends facing families and youth to prior generations. (to return to page 1)
IMPACT OF TAX RATES, COMPARED TO
PAST |
| The charts on the preceding page show stagnant to
falling inflation-adjusted median family incomes for 24 years. That's before subtracting
taxes. The Grandfather Tax Report contains several charts
showing the tremendous increase in tax rates on today's working citizens, especially for
married couples, compared to prior generations. On April 15, 1997 (tax payment day)
newscasts reported that for 1996 the average citizen had to work 5.3 months of the year
just to pay all his share of combined federal and state/local government taxes - compared
to but 1.4 months required of workers several generations ago. That's a 400% increase
in tax-work load - - consuming 44% of an average worker's entire working time each
year. Also reported in the Tax Report, 1996 represented the
highest inflation-adjusted taxes ($22,000) to federal, state and local governments ever
paid in history for a median income dual-earner family. Another new, historic record
negative to families. Tax Foundation's senior economist Arthur Hall.
We will show a couple of the tax charts from that tax report here. The following 2
charts provide some clues. |
Federal Tax Rates up 1,250% for
family of 4 |
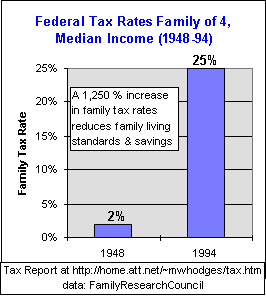 This chart compares the federal income tax rate for 1994 with that of
1948 for a family of 4 at median income level. (data: Family Research
Council, reported October 1996 by presidential candidate Steve Forbes, Impris) This chart compares the federal income tax rate for 1994 with that of
1948 for a family of 4 at median income level. (data: Family Research
Council, reported October 1996 by presidential candidate Steve Forbes, Impris) The
tax rate has jumped from 2% to 25% - - an increase in tax rates of 1,250%.
Primarily to fund entitlement programs of consumption.
Which reduced savings & productivity growth rates by 70% in the past 40 years.
This is one of the many negative impacts on family standards of living today,
compared to prior generations.
The following chart shows additional impacts.
The Tax Report shows in 1996 43% of couples were penalized
by tax laws for being married, compared to had they been un-married. This means they paid
an extra $28 billion in taxes that year due to the marriage-penalty - - money that
that could have been used to improve family finances by reducing debt and increasing
savings, plus providing more funds to enhance choices for improving their children's
education quality. By the way, the 1948 data point in the above chart for income tax was
levied on individuals rather than couples. Now the married are penalized with higher
rates. |
Escalating Impacts Financing the
Senior Generation 5 times larger than before |
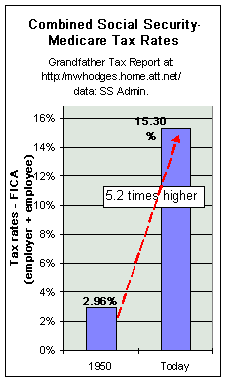 This chart shows the increase in social security & medicare tax rates
on employee incomes - - today vs. 1950. This chart shows the increase in social security & medicare tax rates
on employee incomes - - today vs. 1950. Such tax rates grew from a 2.96% rate to a
15.3% tax rate - 5 TIMES LARGER than today's seniors were paying out.
This picture understates the drain on families compared to the past, since the maximum salary taxed has escalated over the years -
causing tax dollars paid to rise more than 1,000%, inflation-adjusted.
Despite paying a dramatically higher share of their income than did seniors, today's
young, when they retire, will not receive anywhere near the benefits & purchasing
power of today's seniors.
There is zero doubt families have lower living standards as a result of this imbalance.
And, just before family incomes ceased to grow, there were two major impacts on
families: in 1968 Medicare was born and in 1972 Social Security pensions became
inflation-protected - - both programs imposed significant added loads on family NET
incomes, yet they were not inflation protected or given near-free health insurance that
they had not contributed to.
As we saw in the first couple of charts, family incomes are stagnant and falling. Some
will say, how can this be? M.I.T. economist Lester Thurow, 1996, ("the future of
capitalism, pg 41): "If per capita incomes are up yet wages are down, someone has
to be getting all that extra income. That someone is the elderly. The share of the
elderly has doubled in the last 2 decades. It is they who are the big economic winners.
See the Grandfather Social Security Report |
The first chart on page 1 shows stagnant to declining
family incomes. Then, 2 charts showed (over a longer period) rising tax rates, including
the impact of social security & medicare costs on families. With this squeeze, what do
you think happened to the ability of families to save for their future, and to thereby
enhance their security and future living standards? The following chart is the answer.
COMMENTS
[the following comments include links to other reports in the Grandfather Economic
Report series - - which show similar trends, regardless of the subject matter]
- In the period of rising family standards of living, (post world war II, up to mid 1960s)
most families had one wage earner (the male), and many mothers were not forced into the
work-force. She was able to concentrate on her children and family values, if she wished.
During this period average family incomes adjusted for inflation doubled. A win-win
situation for adults, families and their children.
- But, something started to occur that would later negatively impact these trends and
family values. The combined spending of federal and state & local governments, that
had been increasing many times faster than the economy, thereby steadily decreased the
share of the economic pie remaining to the private sector, begin to have their
'creeping-cancer-like' impact. The economy was being restructured such that it became more
and more government spending-dependent (see Grandfather
Government Spending Report ). As seen form the above chart, families were required to
pay a higher and higher tax rates (now 1,250% higher than 1948) to fund government
expansion, which also reduced their effective net income. (not shown are large increases
in state & local tax rates on income, purchases and on their homes).This set in motion
declining personal savings and productivity growth rates for the nation (see Grandfather Productivity Report) - - as the private sector was
reduced in relative size and in its capacity to generate enhance standards of living for
future generations (see Grandfather Private Sector Report).
Additionally, our economy became more and more dependent on foreign trade, and our ability
to compete with a positive balance of payments was lost (see Grandfather
International Trade Report ).
- During the period of rising real median family incomes, the national debt was hardly
moving in dollar turns, and was being reduced each year as a percentage of the economy, as
the economy grew . Said debt ratio dropped to 34% of GDP by 1970. But then it stopped
declining, and then took off upward to a 40-year high of 71% GDP by 1995 - - under the
unprecedented build-up of consumptive social spending, financed by debt. (see Grandfather Debt Report) - - as America became the greatest debtor
nation on earth.
- As federal and state & local governments increased said share of the economy,
regulations mandated by government also accelerated - - negatively impacting national
productivity and real income growth of many Americans. (see Regulation
Report). To cite just one example: the aforementioned report of farm workers having to
enormously reduce their disposable income to seek off-farm rental housing &
transportation, after farmers ceased to provide on-site free housing - - said action
happening in response to government mandating new regulations on housing previously
provided in the past. Who was the winner of such regulations? The worker before
regulations who had a choice of free, un-regulated housing on the farm vs. financing his
own rental housing and transportation off the farm, or the worker after regulation who had
to spend one-third of his wages on rental housing, plus fund transportation to the
workplace.
- As incomes and savings rates began to stagnate, more mothers were forced into the
work force trying to assist family incomes. Not only did this deprive children of a
full-time mother and such family value enhancements, but family standards of living still
did not rise. In fact, median income of full-time males began to fall as seen in the above
chart. So, full-time mothers were lost to the work-force. This resulted not only in
children having less hours of learning from their mother, but her earnings only helped
make up the difference for incomes that otherwise were falling - - and, at best, kept them
even - - neither increasing or falling. (but now, real incomes of females are also
declining).
- As mothers begin to move in greater numbers to the work-force much less time was
available for proper family-value training and control of their children up-bringing and
attention to the quality problems of the school system. Many social ills now plaguing
our nation have flowed from this trend (crime, drug use, and reduced education
quality).
- More couples may choose to remain childless, or start families later in life with fewer
children, thereby reducing the future work-force for their own retirement security. The
data is clear. Economic conditions are such that family members, family values and
futures are negatively impacted. It has become a lose-lose situation for
families and our youth.
- The cause cannot be attributed to education levels attained, since the 1995 Economic
Report of the President to Congress shows inflation-adjusted median earnings of college
graduates has at best been level over this period, and there are more degrees. Those
without college education are not even keeping up. But, it CAN partly be attributed to the
71% DECLINE in education quality/cost productivity index, as covered below.
- The private sector cannot carry the total load since the enormous expansion in the
government sectors has so reduced the private sector 's relative share of the economic
pie that it is less able to carry the total nation's averages (Grandfather
Private Sector Report) This sector must be increased.
- Another major impact on real family incomes, especially non-government employees, has
been inflation - as demonstrated in the Grandfather Inflation
Report. Seniors and government employees were protected, but many private sector
families were not protected from price and inflation, property tax and medical insurance
cost escalation as shown in the Grandfather Social Security Report.
- The Grandfather Social Security Report further shows the
tremendous transfer of wealth from working families to seniors, compared to prior
generations - - resulting in rising consumption by seniors while families, who 'pay the
freight', were squeezed big-time.
- Additionally, during this period of family income stagnation the U.S. dollar fell 70%
against more productive nations (Japan, Germany, Holland, Switzerland, etc.), as
reported in the Grandfather Foreign Exchange Report. If we
would adjust our family income chart at the top of the page in terms of these currencies
our median family incomes and assets have actually plummeted by significant amounts, as
have the possibilities for families to enjoy foreign travel for leisure and education.
During the same period America became the world's largest debtor
nation - as shown in the Grandfather Debt Report.
- Grandfather Foreign Trade Report shows the nation's
increasing dependence on international trade, now with nations with whom we have never
competed - - many of which run better education/lower consumption-driven economies than
ours. Our results are poor, as shown by continued trade deficits, resulting in foreign
entities now controlling 35% of our outstanding debt with its interest income - - and of
the widening gap in foreign reserves per man, woman, and child in favor of foreign
families over ours.
- The Grandfather Tax Report shows zooming tax rates, compared to
past generations, to pay for all of this - with higher rates for married families.
- AND - the Voting Participation Report shows a lower and lower citizen
participation rate in elections - - another indication that living standard squeezes and
loss of choices are turning-off citizens, compared to prior generations - - as they
rightly blame political leaders and central planners of government entities. Down-sizing
government influence on our economy is a needed remedy.
EDUCATION IMPACTS |
| As shown in the first chart above, the 1980's experienced a slight improvement in
family incomes (although they since declined, again). But, the cost of higher education
rose four times faster than family incomes 1982-92 (in this period, costs rose 4%
annually vs. 1% for family incomes). Families had to borrow to finance such education,
whereas prior generations did not. In 1992, 40% of the 14 million students in higher
education at all levels relied on federal guaranteed loans - - up from 30% in 1982. This
resulted in record debt build-up by students and families to obtain higher
learning, compared to prior generations - - placing their living standards as young adults
at greater risk. |
| The Grandfather Education Report documents today's primary
& secondary public schools are not preparing students for the economy of tomorrow, as
well as it prepared prior generations to meet the demands of yesterday - - despite the
significant increases in inflation-adjusted spending per student by public schools- - now
the highest in the world. Receiving less education quality than needed impacts earning
potential of many families in their ability to be prepared for tomorrow's work place. Zero
income growth, coupled with increased property taxes to finance public schools, reduced
the choice of many families to use better-quality private or parochial schools. In this
report, see the Education Productivity Index section, showing a 71% decline from
1960-1994. |
| Not so with foreign students. As shown in the Grandfather
Foreign Exchange Report, the declining U.S. dollar made it easier for foreign
students to attend U.S. universities. The sharp jump in the value of foreign
currencies relative to the US dollar has greatly increased the number of foreign students
with the financial ability to study abroad without debt, compared to U.S. students.
A weak dollar coupled with increased foreign student demand may be one of the
forces inflating university tuition, and thereby requiring more debt by American students.
For U.S. students to consider studying abroad to broaden international knowledge, the weak
dollar diminished such opportunities - compared to prior generations. |
| These forces have had a significant impact on the opportunity to acquire professional
education in the important science, math and engineering categories - even in the U.S. The
Grandfather International Education Report shows about half
all new doctorates in these important disciplines graduating from U.S. universities
are foreign students. The lower cost to these students (due to the higher value of their
home currencies), coupled with better foreign high school quality, prepares these students
to dominate science & engineering, and to therefore qualify for near-free graduate
school funding via research & teaching assistantships from our universities. According
to the 1993 National Science Board study, 80% of foreign graduate students are in this
category of funding. Again, foreign students have a better chance to develop scientific
careers in research, engineering and university teaching than American students,
compared to prior generations. |
| Bottom Line : American students and families are at a disadvantage
concerning education, compared to prior U.S. generations and to today's foreign students -
due to a mixture of structural problems impacting their incomes and education quality. It is clear that a possible strategy for a family competing in a global
economy, which will provide a competitive advantage to the most technologically
skilled work-force, is to make a major effort to significantly increase the math and hard
science educational skills of every family member - from first grade through college. In
the short-run it must be recognized this will require more families to invest in
higher-quality education - - than now provided in a majority of public schools and
colleges. Considering the trends of the above family income charts, this will be a great
challenge - - which can partially be overcome if government will down-size its spending
and resulting taxation.
In the meantime, families must pull out all the
education stops they can for their main bread-winner and the kids. |
Some CAUSES & ACTIONS
There are many theories presented as to the cause of these
unacceptable findings. This author submits that part of the cause is the fact that excessive
levels of federal and state/local government spending (primarily government
entitlement programs), and regulatory compliance costs, relative to National Income,
together with the level of total debt and a reduced international dollar, have eroded the
true private sector and its ability to generate living standard improvement. Additionally,
higher and higher tax rates mandated on families by federal and state & local
government, much representing income transfers from families to seniors and welfare, has
reduced net income, savings and productivity - helped push mothers to the work-force away
from their children. A type of 'critical mass' has been exceeded. Slowing the
growth rates of spending & regulation, and reducing deficits is insufficient. Spending
& regulation cost ratios to economy size must be cut significantly and the debt
principal must be amortized - - and family income, social security and property tax
rates should be reduced to levels of prior generations.
The President's own economic report discusses much new
government activity that should be energized to counter act this trend, such as the
over-used political phrase of 'making government more productive'. But, nothing is
mentioned concerning the actual down-sizing of government (and its mandated regulatory
burdens), in real and absolute terms, to return to historic ratios of spending to national
income - and thereby increase the share of the economic pie to the private sector that is
not dependent upon government spending. Neither is there mention of the excessive
levels of taxation at all levels of government which is eroding the private sector and
net income of families. Further, the rising spending ratios of state & local
government are not mentioned, although such spending is eating up more and more of the
private sector's share of the economic pie, as if this is of no concern to our nation.
As a bottom-line cause: it is my opinion that family incomes are under pressure compared to the
past because we have too much government with too much taxation & regulation, which is
invested in socialized consumption instead national productivity, and with too little 21st
century technical education quality in our public schools and colleges - - to allow more
of our citizens to effectively compete in the increasingly more competitive global
economy. Families should not wait for government bureaucrats & politicians to 'save
them' - they must reduce their own consumption and invest more of their own productive
time in high-quality education and savings. In other words, families must face the reality
of the situation - - or suffer its consequences.
The following chart series shows the shrinkage of the private sector's share of the economic
pie by the blue color,
due to growth faster than the economy of the federal sector (red color) and the state & local government sector (yellow color).
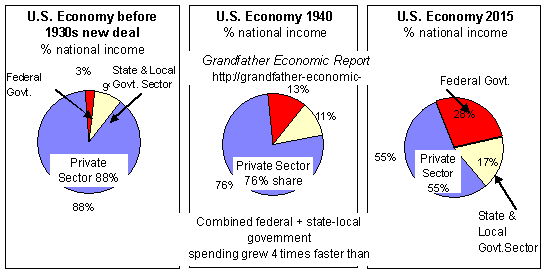
The private sector's share (blue color) of the economic pie has been steadily reduced as the federal government
increased its share by 1,000% from chart 1 to 3 and as the state & local government
share increased 3 times faster than the economy since the middle chart. From an economy
where the private sector represented nearly 90% of our economy to the current situation
where the government sector is now nearly half the total economic pie.
Bottom Line: If it is a national objective to restructure such that there can be
sustainable long term growth of real family incomes and standards of living, this can only
occur if growth rates of savings & national productivity are significantly increased.
But, these growth rates have declined in the past
40 years. Since most economists agree improvement of such
must come from the private sector, then it stands to reason that the private sector must
be increased in its share of the economy - - which can only occur by reducing the share of
the economic pie now dependent upon government spending, together with significant
decreases in mandated regulations impacting productivity, and tax rates.
An approach that should be considered is to study the inequities
between families from the private sector (which are do not have their incomes
inflation-protected by government mandates, or the same level of employer-paid health and
pension benefits as government workers, nor the same lay-off protection) and government
sector employees. Reducing the share of the economy dependent on government spending would
be in the right direction. To help bring about more fairness, equity and equality between
families, this should be undertaken by studying a combination of :
- Elimination of cost of living adjustments of those receiving
incomes from government tax sources, and requiring all employees to fully pay for their
own health insurance and pension programs.
- Reducing government spending in absolute terms, to reduce its
share of the economy's national income, and tax rates.
- Privatizing more government functions, including education and
many other federal and state & local agencies.
- Developing a strict control of cost accounting and audit on
un-funded regulatory compliance costs imposed on the private sector by federal and state
& local government entities.
- Our education quality must include much higher levels of technical
excellence achievement, and be proven to far exceed that of our international competitors.
BOTTOM LINE SUMMARY of ACTION to IMPROVE FAMILY
INCOMES
- Reduce government spending ratios, at both the federal and state & local
level. The only politically effective means of accomplishing this is to reduce all tax
rates on working families - - starting with elimination of the marriage penalty.
- Restructure the education delivery system that gives parents more choice to
select any school (private or public) - - to seek significantly higher levels of education
quality (especially in math and hard sciences), than is now provided by the current
system. Only with significantly higher education quality can today's young people
effectively improve their own family incomes, while facing accelerating competition for
said income from the global market place - - a challenge that was never faced by today's
seniors during their early working careers.
OUR CHILDREN AND GRANDCHILDREN DESERVE
BETTER
SUGGESTIONS as to where you might like to go from here:
- Re-review the two dramatic charts on
page one of this report - the prime pictures for this Family Income Report..
- Return to the Home
Page of the Grandfather Economic Report - - for its listing of related sub reports
comparing now vs. then.
- Or, consider jumping to one or more of the following related
sub-reports in this series, each impacting family incomes:
Go to the top
| Home
& Contents | Summary | Feedback
| What's New | Eye-opener
| Must See |
Copyright
© 1997-2011 Michael W. Hodges. The Grandfather Economic Report series is
the intellectual property of its author; all rights reserved under Copyright Conventions.
Permission to redistribute all or part of this series for non commercial purposes is
granted by the author, provided the associated web page address is included and full
credit given to the Grandfather Economic Report and the author, Michael Hodges. Notice
appreciated via email.