GOAL: The best quality in the world, without any doubt ! |
Grandfather Economic Report series
| Education
Series Home & Contents| Grandfather
Economic Report | Summary | Link Index | Feedback | What's New | Email
Grandfather Education Report |
GOAL: The best quality in the world, without any doubt ! |
[ give the 10 neat color data-pictures a chance to load - 'a picture is worth a thousand words' ]
NOTE: first we repeat some of the summary page, and then to the meat
4 Questions asked by 2 grandfathers with 11 grandchildren |
DO OUR CHILDREN DESERVE TO RECEIVE:
|
For some answers to these critical questions, read on |
PUBLIC EDUCATION PRODUCTIVITY DECLINES 71% IN 35 YEARS- while spending rises, quality declines - |
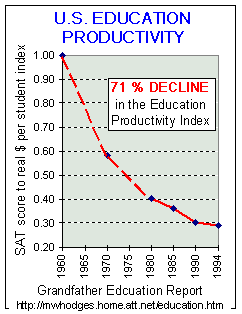 Education productivity is a ratio that compares national education quality output with
inflation-adjusted spending per student.
 The left chart shows the dramatic 71% decline in education productivity over the past 3 ½ decades. That's because SAT scores, a long-term measure of quality, fell over this period despite record increases in real spending per student. (data table below, including explanation why this chart stops at 1994 because SAT testing criteria were made less rigorous). The chart decline would be even steeper if we added (to secondary education costs) remedial course costs in colleges required due to poor high school quality output - - which ought to be done for accountability. ``The quality of schooling is far worse today than it was in 1955,'' Nobel laureate Dr. Milton Friedman recently wrote in the Washington Post. Note the chart's 1960 data point and the trend thereafter. With this in mind, think of this: "Since 1962, when teachers were first allowed to unionize, the public school system has been a system that benefits and answers to the producers of education, not to the consumers. 88% of America's schools are government schools, and 75% of the teachers are union members." John Fund, Editorial Board Wall Street Journal, May 1998 Imprimis volume 27, #5. And, as the president of the American Federation of Teachers recently said: "I will begin to care about the quality of children's education in this country when they start paying union dues." Al Shanker, union president. In today's more technology-oriented and competitive world, the U.S. should be producing much higher SAT results than 35 years ago, with real diplomas reflecting real mastery of all subjects, especially with three times more real spending per student. High schools should not be allowed to graduate students requiring remedial education - - especially at the astounding rate of two-thirds! Were two-thirds of high school graduates in 1960 receiving bogus diplomas? Where's the accountability? Why should taxpayers fund such performance? And. we should be producing a higher advanced exam graduate percentage than foreign students. We are not. Is quality getting better? More evidence:
Additionally, it can be shown that the trend of the above chart also follows the trend of another chart regarding trust in government - both have significant declines in past 3 decades. |
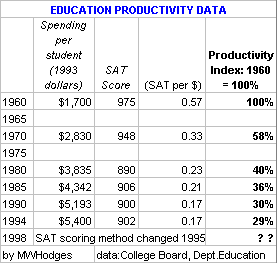 The left data table (for above chart) shows school quality (SAT scores)
lower than in 1960, yet inflation-adjusted spending per student is 3.2 times higher.
(data source included on page 2, link bottom page). The left data table (for above chart) shows school quality (SAT scores)
lower than in 1960, yet inflation-adjusted spending per student is 3.2 times higher.
(data source included on page 2, link bottom page).With such increased spending per student SAT's should have moved above 1960 levels - - instead of falling. And, this decline in output quality occurred despite smaller class sizes and more non-teaching employees per student than before. Despite significant funding increases, the quality performance of primary & secondary public schools is less than 35 years ago, and we are below average on the list of industrialized nations in math & science testing. And, our inflation-adjusted per student spending is the highest in history, and the highest in the world. (Note: it should be pointed out - starting 1995 the 'powers to be' revised SAT scoring criteria and made the test less rigorous than past tests - which effectively camouflages comparing future SAT performance to much higher results achieved in the past. Some could say if one wants SAT scores in the future that cannot be compared to higher scores in past decades, without improving student learning, simply make the test less rigorous and change scoring - - just as if the distance to the left field baseball stadium fence was reduced to produce more home runs ). More current data show the education quality to cost problem continues un-resolved. 1998 spending per student was about $6,500, nearly half of which was eaten up by 'non-instructional services' - - mostly administration. (The Economist 1/16/99). And, education quality is perhaps more dismal than ever before, as covered below showing our 12th graders came near last on the international math & science tests, our 8th graders again performed worse than 27 other nations, and two-thirds of our 4th graders read below grade. We are spending more, and getting less ! Are we 'abusing' our youth ! |
THINK ABOUT IT
Instead of cleanly and convincingly fixing the problem of 35 years of negative SAT trends, excuses are being given of such non-academic items as gender bias, or too much vocabulary and attention to math, or the need for calculators, PLUS educators are revising tests and scoring methods. Its equivalent to the national baseball association being unhappy with fewer home runs than the past, deciding to 'solve' the problem by moving left field fence closer to home-plate. Or, the NFL desiring higher scores and deciding to solve that by giving 9 points for future touchdowns, or revising the size of the playing field.
Additionally, our past president called for volunteers to teach our kids, while many educators blame parents. Can you imagine how far Wal-Mart or General Electric would get if their management blamed poor quality and high prices on their customers, and asked even higher prices plus volunteers to resolve shortcomings? Since private sector firms have formidable competitors world-wide, and since their customers are free to choose among many competitors, these firms would have to restructure in a major way, or go out of business. The government education system is not required to compete, and therefore produces the obvious comparative result. Its delivery system needs major restructuring to force it to compete in the open market, to produce more quality and customer (parent) satisfaction per dollar - - not just adjust quality measurement methods, demand more money, hire more non-teaching personnel, raise compensation packages, build more buildings and call for volunteers.
THINK A BIT MORE ABOUT IT
"Apologists insist that scores are down because the fraction of students taking the test is up. Perhaps: 42 per cent of seniors took the SAT in 1994, and 43 per cent (a record) in 1993. But average scores managed to rise between 1952 and 1963 even as the share of test-taking seniors exploded from 7 per cent to 30 per cent. Scores fell during the 1970s although fewer students took the test.
The practice of "teaching to the test" is far more widespread today, as are supplementary preparation courses. And the test itself was recently overhauled, allegedly to emphasize academic preparation rather than innate ability.
The U.S. spends more per student than any other G-7 nation, yet in 1991 our 13-year-olds came in last on science and math achievement tests given to virtually all students in those countries.*
Official spending figures are themselves suspect, omitting key items such as pension contributions, business and foundation donations, teacher training costs, out of-pocket parental expenses, and the cost of federal programs not administered by the Department of Education, such as Head Start. A comprehensive analysis would undoubtedly find a still sharper productivity plunge." Ed Rubenstein, Sept. 1994, National Review.
Additional evidence of poor output quality is the fact that "of the 12 California state university colleges, 60% of students need remediation; a Florida study shows at least 70% of recent high school graduates need remedial courses when they enter community college - - in other words, they need to learn material they should have mastered in public high school - but did not - - costing an extra $59 million per year." Source: USA Today, pg. 14A, November 24, 1997. That averages out to two-thirds of high school diplomas are bogus - despite record per student spending! (see Remediation Report). And Grade Inflation is rampart - - in high schools and colleges.
The President of the United States (Fall 1996) called for volunteers to help teach grammar school students to read. Would he have said that if he thought our present public school system was doing the job, despite record spending? 'In 1995, NAEP shows that barely 36% of 12th graders can read at the proficient level, and only 31% of 8th graders and fewer than half of all fourth graders.(Center for Education Reform).' This data suggests that a whopping two-thirds of our students are below proficiency levels, which helps explain why so many colleges are both reducing standards and providing remedial courses. Are two-thirds receiving D and F grades in school, and are they being held back from advancing to the next grade, to help parents understand what NAEP claims and to demonstrate to students and the profession the consequences of poor performance? Or, are we rewarding lousy performance with 'social promotions' to cover it all up - - to the detriment of our nation and its children? Parents are catching on, as shown by many polls.
Home-schoolers outscore public schools 70%. William Mechlenburg writes: "A recent study by the National Home Education Research Institute indicates that home schooled students scored 85 points versus 50 points for public schools on standardized national achievement tests. This differential existed regardless of race or economic status. The scores also were insignificantly different between home-schoolers from states with high or low regulation of home schooling. I think the important point here is that essentially a bunch of amateurs in the home out performed the so called "professionals" in public education." (Source- Reason Magazine Aug./Sept 1997). Further, on 25 September 1999 the Associated Press reported 'the Daughters of the American Revolution's outside study last spring showed home-schooled students score well above the national median on standardized tests and often study above their normal grade level.' (source - AP via The Bradenton Herald, 9/25/99, page 6).
And, SOME MORE
'Money & School Performance'- Paul Ciotti, March 1998 - Test scores did not rise despite the smallest class sizes (12:1) and highest spending ($11,700 per pupil) in the nation, including highest teacher salaries and capital spending - Kansas City Experiment. (see Grandfather Links Page - education section).
'Productivity Collapse in Schools' - Eric A. Hanushek (University of Rochester) - (see Grandfather Links Page - education section) - 'Education has had relative productivity declines of 3½ percent per year compared to the service sectors.' - a similar finding to that of the Grandfather Education Report's productivity index chart (derived via a different method) shown at top of this page..
Enlightening comments from teachers, professors and students confirm that dumbing down of quality standards, grade inflation and social promotion are not only the norm but escalating - and teachers are much less effective than years ago and they are embarrassed, scared, and frustrated. (see the well-documented, extensive Comments by Others Report).
IS THERE A WASTE OF $72,000 PER STUDENT ? |
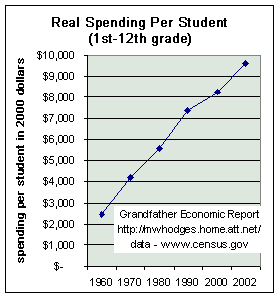 This chart shows total inflation-adjusted
spending per student for primary & secondary public education was 4 times
higher than $8,271 in 2000 compared to 1960. The inflation-adjusted spending per
year increased $6,000 over this period. Per the chart for 2002 costs increased to $9,578 This chart shows total inflation-adjusted
spending per student for primary & secondary public education was 4 times
higher than $8,271 in 2000 compared to 1960. The inflation-adjusted spending per
year increased $6,000 over this period. Per the chart for 2002 costs increased to $9,578What do we have to show for that huge increase??. (And, R. Vedder reports non-teaching employees per 100 students increased 3.4 times 1950 to 1990. This tells us a lot of the increased costs has to do with overhead, not just teachers). This 4-times more spending cannot be justified unless today's measurable education quality output is more than 4 times higher compared to the past. Is the SAT average 4 times higher? NO way ! Are we outscoring students of all foreign industrial nations in math & science? NO, we are below average. See the Internatioanl Test Report Even if we were producing the same quality output as before, the $6,000 per student increased cost would not be justified. Therefore, this excess spending is a wasted resource. This potential waste (per year 2000 above chart) equates to $72,000 per student from 1st to 12th grade ($6,000 x 12 years of school), a significant drain on our economy. Investment with negative returns. At $6,000 per student per year potential waste equates to $258 billion per year potential waste for the total system of 43 million students. Instead of incurring this system waste, what would parents say if a $6,000 check was sent to parents each year for each of their school kids. Additionally, the costs shown in the chart do not include the huge and growing remedial costs experienced by colleges and parents due to poor quality high school education. See the Remediation Cost Report. NOTE: In 2000 there were 43 million students enrolled in public elementary & high schools, about the same number as enrolled in1970 - which should have made it easier to control spending per student. And, in 1960 total spending (in 2000 dollars) was $90 billion, yet 2000 consumed $360 billion. These charts lend support to the following quote: "There is a strong case for a negative correlation between educational achievement and expenditures." Dr. Walter Williams, Chairman, Dept. of Economics, George Mason U. That quote is further supported by this statement: "On average, students in the top 5 states in per-pupil expenditure (Alaska, New Jersey, New York, Connecticut, Rhode Island) fare worse on the SAT than students in the bottom 5 states (Utah, Arizona, Arkansas, Oklahoma, Mississippi)." National Review, Sept. 14, 1998, pg. 30. NOTE - - the above chart shows data up to $9,600 in the year 2002. Bloomberg on Sept. 2006 reported the OECD (the international Organiation of Economic Cooperation & Development) public school costs in the U.S. was near $12,000 per student - - or about 40% higher than just 3 years earlier in 2000. Source: Sept. 12, 2006 (Bloomberg) By Paul Basken http://www.bloomberg.com/apps/news?pid=20601103&sid=as_58xYSH1yw&refer=us HOT - The above cost waste understates the situation, if we charged back to high school districts the amount of money spent at the college level in remedial education because of poor high school output quality - - which according to college professionals represent a large part of the freshmen in colleges and universities (including military academies). This remedial cost pushes up college prices also for the fully qualified freshmen, driving many to student loan burdens. All such costs should be charged as k-12 cost accounting. (Covered in College section, below). |
|
2. Bureaucracy & Regulations: More than half the money for public education is CONTROLLED by federal & state bureaucracies - immune from parental influence. This provides a 'siphon' opportunity from classroom efficiency and quality, PLUS tremendous centralized power to mandate regulations on local school districts. Further, such power provides a focused, centralized 'playground' for unions and social do-gooders to leverage their narrow interests, without answering to world-class quality, local school boards and parents - - plus self-serving resistance to change. Central planning has been a failure concerning democracy, efficiency and quality, wherever tried. Education's record fits - PERFECTLY! Consider downsizing all federal-state education bureaucracies by 95%, and restricting national union and federal & state government influence over local school boards and their employees - - basically, restructure-decentralize-privatize. See Centralized Power. 3. "Government employee compensation grew much faster than private sector wages in almost every state, the equivalent of a major income transfer program, which inhibits growth. Data from Ohio show that spending on education has some positive though diminishing effects on student learning when the money is spent for actual instruction, but administrative expenditures, which have been growing in relative importance, tend to have negative effects on learning." National Center for Policy Analysis #178, "Economic Impact of Government Spending: A 50-State Analysis." 4. Not only are we potentially negatively impacting education quality while generating economic waste, but the 'WASTE' reported above contributes to a lowering of median family incomes of non-government workers - as those producing that lower quality receive faster-growing compensation. 5. 1998 spending per student was about $6,500, nearly half of which was eaten up by 'non-instructional services' - - mostly administration. (The Economist 1/16/99, pg. 55). |
Education Waste negatively impacts quality of life of families & seniors |
| Since families pay escalating school taxes on their homes and purchases, education
waste negatively impacts family net incomes and savings. During the period of
soaring real spending per student, median family real incomes have stagnated and fallen
over the past 2 ½ decades (see the Grandfather Family Income Report). Such
waste reduces family choice concerning many decisions - - such as choosing alternative
education providers - - and, allowing mother to stay at home to better guide the
development of her children. Such waste negatively impacts senior citizen living standards and stress, as their home property taxes soar - - forcing some to give up their long term homestead. Further, waste reduces national productivity and the nation's competitive posture relative to other nations (see the Foreign Trade Report). The problem cannot be too many students. In 1995 there were 50.8 million students, compared to 51.3 million in 1970 (DOE source). The problem is lack of efficiency in per student spending and measurable quality output. If a private sector business operated as such it would have been liquidated long ago. In the opinion of the authors this cannot be resolved unless the system is restructured and fully opened to free-market competition - in fairness to families, children and seniors. |
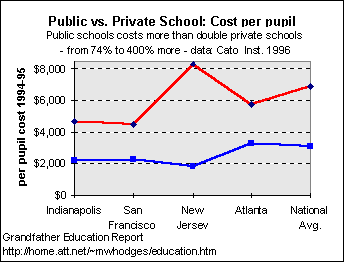 The left chart provides comparative cost per student data of
public schools (in red) vs. private schools (in blue) of four different areas of the
nation, and for the national average.
The chart clearly shows public school cost per student (red line) is from 74% to 400% higher than private school cost per student (blue line). The national average cost per student of public schools was $6,857. This was 120% higher than $3,116 for private schools, and 215% higher than $2,178 for catholic schools. (data source was Cato Institute March 26, 1996 and national average U.S. Dept. of Education Digest of Education Statistics 1995).
It is obvious that there is urgent need for serious reform, unless it can be proven that the average public school is producing 74% to 400% better quality than private schools - - - and that public schools have a higher teacher-student ratio than private schools - - - They do not !
"Parochial schools, with about the same ethnic mix and costing two-thirds less per pupil, out-scored public schools by 37 points on this years SAT." E. Rubenstein
How about grammar school? Were you surprised in April 2001 with this: 'Two-thirds of U.S. fourth graders read below grade level and the weakest ones are falling further behind', according to the U.S. Education Department's reading ''Report Card'' released on 6 April 2001. Students reading at a proficient or advanced level from private schools performed 57% better than public schools. Reuters release.
Public school spending per student may be 2-3 times higher than public schools of several major industrial nations, if the past 14 years of exchange rate effects which inflate their levels in dollar terms are subtracted. See the International Education Report.
Keep in mind that the above chart is from 1995. According to OECD data in 2006 (reported above), public school costs were closing in on $12,000 per student. Per Statistical Abstract in 2002 it was $9.600 per student grades 1-12 for public schools in the U.S. For private schools, the 2002 average cost per student was $6,809. This shows public schools cost 41% more per student in 2002 than private schools. Source 2002 data: 2006 Statistic Abstract, tables 204-05
Should we introduce more parental choice and competition before more damage is done to future generations and our nation?
More on private schools vs. public schools below
STUDENT -
TEACHER RATIOS
|
 We have heard public school officials and their unions claim in recent
years that much smaller class sizes are the answer to providing much improved education
quality, and if only the public schools could have more money they would hire more
teachers to lower the current ratio and resolve the quality problem. Should we believe
that? Suppose public school test scores fell (instead of rising) as the
student-teacher ratio (class size) is reduced? That's what has happened. One could argue
there is an inverse relationship between test scores and fewer pupils per teacher in the
public system - - which will be proven below. We have heard public school officials and their unions claim in recent
years that much smaller class sizes are the answer to providing much improved education
quality, and if only the public schools could have more money they would hire more
teachers to lower the current ratio and resolve the quality problem. Should we believe
that? Suppose public school test scores fell (instead of rising) as the
student-teacher ratio (class size) is reduced? That's what has happened. One could argue
there is an inverse relationship between test scores and fewer pupils per teacher in the
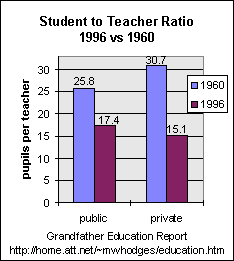
public system - - which will be proven below. The left chart has the data - right out of the 1997 US Statistical Abstract. The two bars on the left represent public school pupil-teacher ratio in 1960 vs. 1996. During that period the pupil-teacher ratio (or, class size) was reduced 33% (from a ratio of 25.8 to 17.4), yet during the same period SAT scores fell - instead of rising - - and the education productivity index fell 71% (see chart at top this page) - and U.S. students continued to score at the bottom of the heap on the international math & science test series - - as inflation-adjusted per student spending soared, and the ratio of non-teaching employees per student zoomed upward. A NEGATIVE RETURN ON INVESTMENT! The two bars on the right side of the left chart are student to teacher ratios for private schools which also dropped, from 30.7 to 15.1. Now compare the two maroon bars for 1996. Note that the right bar for private schools had a pupil to teacher ratio of 15.1, which is below that of the 17.4 for public schools for the same year. One could ask if the cost of operating public schools is several times more per student than for private schools, how come the lower cost private schools can achieve a lower pupil-teacher ratio than can public schools? The answer must be in efficiency, accountability and quality/dedication of teachers, as well as the much larger, expanded percentage of non-teaching employees in the public school system. And, private schools are the system of choice for the children of teachers and politicians with the economic means of free choice. No wonder, since they know (as reported above) that private school quality performance significantly exceeds public schools. If we examine the top 20 nations ranked for U.S. equivalent 8th grade mathematics classes in 1982 we find Japan had the 3rd largest average class size (41) yet ranked 1st in test scores. The U.S. and Hungary both have relatively small average class sizes yet Hungary ranked 3rd and the U.S. ranked 14th on test scores. Hong Kong has the largest classes (44) and ranks 8th on scores. 1999 TIMSS data show a similar relationship. The latest international math & science exams showed U.S. students ranked lower than their international competitors than ever before - - at the bottom of the list - despite smaller U.S. classes. While many justifiably argue that the public schools must get their quality-act together, we must not allow the school systems to claim this can be achieved with a lower pupil to teacher ratio and therefore they must have more money - - as lowering class size any further for the public system may produce even lower quality. This chart lends added emphasis to the chart near the top of this page showing $3,700 per student per year waste - and suggests that the call for more teachers to resolve the public school quality crisis is perhaps more a jobs-creating program for unions and administrators than a quality improvement action. This chart, and the one above on non-teaching personnel, suggest that there is plenty of evidence that there is simply too much money in the public school system and that more money may degrade quality even further- - especially if spent on payroll. Can you imagine someone trying to justify billions of additional dollars for millions of additional teachers and classrooms to reduce class size without measurable improvement in student achievement? If the teacher's union proposes such we would understand the motive - - more dues-paying members - - to the detriment of taxpayers, parents, and quality achievement for students. Someone said, 'Its the system, stupid - - not the money spent on the system.' MORE PROOF Following from Jim Glass - May 1998 >>There have been literally hundreds of studies that have failed to find any relationship between class size and student achievement since the famous Coleman Report failed to do so -- to the surprise of everybody, including Dr. Coleman -- back in 1966. A good survey of current research is: Assessing Educational Practices, edited by William E. Becker and William J. Baumol, MIT Press. Some brief excerpts on the class-size issue: "Teachers and parents overwhelmingly favor small classes, but their value has been devilishly hard to prove in spite of voluminous research. "Three recent studies (Card & Kreuger, Ferguson, and Folger & Brenda) finally provide some small support for the idea. However, the first two studies do not examine the question of cost effectiveness. Folger & Brenda found that reducing class size from 25 to 17 produced modest gains that appeared only in kindergarten and first grade. They conclude that reducing class size is not cost effective. "Stevenson & Stigler suggest a better way to use additional funds than reducing class size. After examining international practices, and citing evidence that academic improvement can be achieved more effectively through improving teacher training and increasing academic rigor in the classroom, they propose *increasing* class size somewhat (reducing staff) and investing the savings in fewer higher quality teachers of higher standards and training. "This implies reorganizing the way schools assign duties to teachers. Whatever the merits of the Stevenson-Stigler approach, legislators and school boards need to find better ways to use additional money as it becomes available than simply reducing the number of students in each classroom." (for a lengthy evaluation of past research, see the Study by L.A.Dickson). That's right folks, top-down mandates for across-the-board reduction of class size are a *bad* idea - - and give the appearance of a continuing scam for lots of money camouflaged as a cure-all for unacceptable education quality - instead of decentralizing & redesigning the system. Here's another study showing that > > Each One Student Increase in Class Size Parallels a Four Point Increase in TIMSS Math Scores. The TIMSS-R study conducted in 1999 showed a pattern similar to the 1995 study, which is that each additional student per average classroom paralleled a four point in crease in TIMSS Math scores. This is not necessarily proof that all we need to do to increase math skills of our students is to double or triple the size of our classrooms, but it is proof that education quality does not suffer from increasing the number of students in a classroom, and that education quality can be retained in large classrooms. Reference and Charts. The near universal public assumption that smaller class sizes always are better is probably the single greatest myth about education today - - a myth created most likely as both a public relations smoke screen for school administrators, to gain more funding without a return on investment in measurable quality enhancement, and as a job-creating program for which the unions would have much interest. Bottom-line on class size: local school boards may be doing a disservice to their community and to students by spending one dime to reduce class size for grades 2 and above. Instead, they should put their money into higher quality teachers and stricter testing of both students AND teachers. And, all 8th and 12th graders should be required to take the international math & science test series, and all parents should know their results vs. U.S. averages and relative ranking with students from other nations. |
The Philadelphia Daily News 2/14/96:
Imprimis, April 1997, Hillsdale College - article by Jeb Bush, chairman, Foundation for Florida's future:
US News & World Report, April 1, 1996:
Mason-Dixon Poll, in Florida, March 30, 1997:
Department of Education's International Assessment (1995 Digest of Education Statistics)*:
The Economist magazine (January 16 and 23, 1999 issues): More than 40% of American 10-year-olds cannot pass basic reading tests, yet half the $6,500 spent on each child is eaten up by 'non-instructional services - mostly administration.' In Texas, in 1998, 40,000 children aged 9-10 failed standardized tests, yet 90% were promoted anyway.
A COMPARISON TO FOREIGN EDUCATION(For a complete report on foreign comparisons, with dramatic color graphics: see the International Education Report. Following is an excerpt.) |
| The Paris-based Organization for Economic Cooperation and Development, whose 1994
survey of the U.S. economy devoted an entire chapter to U.S. education, concluded
"the effectiveness of the primary and secondary education system can broadly be characterized
as mediocre at best." The OECD analysts went on to observe, "While it is
true that American schools do a particularly poor job of educating blacks and Hispanics,
one should not conclude that white students in middle-class suburbs are uniformly well
served. In mathematics and science, the nation's top high school students rank far
behind much less elite samples of students in other countries." OECD's 1996
education edition continues to show our poor relative performance, especially in the 8th
grade math test series. It is clear the U.S. has an 'Education Quality Gap,' much
like our former 'missile gap.' Were you surprised on 24 February 1998 that the Third International Math & Science series showed that U.S. 12th graders scored behind every nation, except Cyprus and South Africa? Even comparing our elite to the elite students of other nations, Americans were near the bottom. In Physics we were at the very bottom. Were you surprised when, on 20 February 1997, ABC-TV Evening News reported U.S. 8th graders scored behind 27 other nations in math? The quality gap is real, compared to foreign nations today, and to prior generations at home. Are you aware that our younger generation, when they enter the workplace, must economically compete with parts of the world that until now were 'locked-out' from challenging prior generations - such as Eastern Europe, China, the former Soviet Union, etc.? These nations produce superior education quality with technical competence within their more than 1 billion populations, and are poised to strongly compete in order to raise their future living standards, at the expense of ours. Our living standards and national security may be at risk, unless we make a mega-jump in measurable education quality - - with the strongest ever emphasis on math and the hard sciences. |
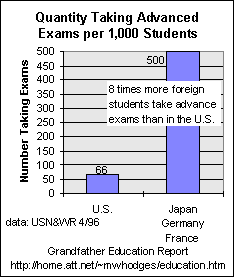 A 1996 US News & World Report study showed that students in Japan,
Germany & France: A 1996 US News & World Report study showed that students in Japan,
Germany & France:
which means foreign schools are 8 times more intense in pushing for measurable quality at advanced levels of learning. |
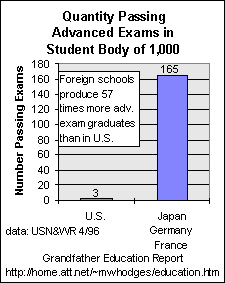 Not
only do more foreign students take advanced exams, but the same data shows: Not
only do more foreign students take advanced exams, but the same data shows:
Shouldn't our system demand a higher level of advanced graduates, including math & science scores, than all other nations? Does the school system report to parents how each of their children is performing compared to foreign students of the same age? NO!! Why not?? If parents knew they would demand major changes. |
It may be concluded from the above evidence that foreign schools compared to U.S.:
|
| SUMMARY: A picture emerges of a very dangerous deal for U.S. students and the future of the U.S. economy concerning foreign trade balance of payments, standards of living and national security. |
| For additional dramatic foreign comparisons, shown by color pictures: see the International Education Report
on primary & secondary school spending & foreign quality in higher education for
math & science - not only in foreign schools but right here at home in our own
universities from fast-growth nations such as China. That report puts to bed the term 'gender bias' - our problem
is not 'bias' - its a 'quality gap.' The Third International Math & Science Test series showed U.S. 12th graders scored behind every nation, except Cyprus and South Africa? Even comparing our elite to the elite students of other nations, Americans were near the bottom. In Physics we were at the very bottom. Or, the December 2000 report that our 8th graders scored behind 27 other nations, again. International Math & Science Test. Comments by teachers, professors, students and parents are provided in Education Articles. The International Trade Report shows one-third of the economy is dependent on global trade, three times more than before - and, trade deficits are soaring, indicating we are competing worse than ever in our nation's history - - and, competition is mounting at a faster pace including from nations with which we have never before competed. COLLEGES - lowering standards to meet lower incoming quality and driving up costs & debt - Are U.S. colleges hanging tough by continuing tight admission standards and course requirements - refusing to yield to the poor quality output, 'social promotions', inflated grading, and 'dumbed-down' testing standards of secondary schools? ANSWER: No! They are lowering the hurdle. The College Standards Report shows colleges have responded by dramatically reducing former mandatory requirements and standards for demanding core courses (e.g. math, science) and admission standards, and with fewer classroom days - - compared to prior generations. A tremendous percentage of college freshman require extensive remedial work in math and/or English. Why did our high schools graduate those students, and why must many go into debt with college loans to cover that which high schools failed to do - - and, shouldn't such costs be charged back to the local school district to tighten things up? This is another 'data point' for poor quality output of secondary schools. Instead of holding fast to high standards, colleges reduce them. Lower college standards produce more un-qualified college students, which increases costs and debt load on students that are prepared. The College Standards Report suggests firm action required in higher education, too. Our kids are simply at great risk: from grade 1 through college. |
What Percentage of the Nation's Students go to Private Schools? |
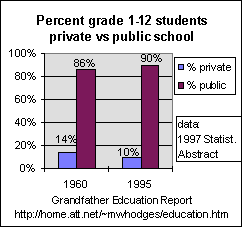 This chart shows the percentage of students attending private vs. public
schools. This chart shows the percentage of students attending private vs. public
schools. In 1995, 90% of our nation's 46.7 million students went to public schools. This shows part of the nation's available opportunity. Only 10% attended private schools in 1995, down from a 14% share in 1960. Previous charts show the public school system is producing less quality than 35 years ago, a worse teacher to student ratio, and a much higher per student cost than private schools - - yet the public school monopoly grows larger instead of smaller. The nation may be better served by reform that reverses these trends in favor of more choice. With the significant excess (wasted) per student costs in the public system, there are more than enough funds to be re-deployed toward more family choice and competition. Why is the better performing private system losing market share, despite negative productivity curves of the public system? 90% of the market is a monopoly It has been said many times 'that any provider that commands 90% of the market - whether we are talking about phone service or heating oil - is by definition, a monopoly. Our government employees thousands of bureaucrats to track down and break up monopolies on the grounds that monopolies stifle competition and thereby produce inferior products at high prices. Doesn't it strike anyone as strange that the same government protects its own monopoly in education? And stranger still that many accept this state of affairs as normal?' Feb. 1999 - Jennifer Grossman, Children's Scholarship Fund. |
| Parents are under the pressure of having less (instead of more) choice.
Families are mandated by law to pay increasing property taxes to fund the higher
cost/lower quality public system, together with increases in other taxes, while real
median family incomes have stagnated and fallen over the past 2 decades. Therefore, it has
become more difficult (instead of easier) for families to finance both systems - - and
more are shut out of choosing the best quality education for their children. This is
another type of 'Child-Abuse.' Meanwhile - - teachers and politicians (among others), with enough income to pay public school property taxes plus a private school tuition, are making a clear choice by sending their kids to private schools - - another indication of which system (public vs. private) offers the best quality. |
| More funding is not needed. We must mandate reform which redistributes existing funds (which include an indicated 'waste' of $44,000 per student) to more parental choice to stop this abuse. |
Are there real actions to improve education quality, or simply revising the tests ? |
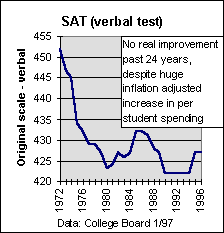 The chart shows the trend of the verbal part of
SATs since 1972. (not shown is the period prior to 1972 when scores were even much
higher). The chart shows the trend of the verbal part of
SATs since 1972. (not shown is the period prior to 1972 when scores were even much
higher). "Less-academically gifted students did not cause the decline in SAT scores since 1972. It was a sharp drop in performance among students in the top 20 percent of their class that pulled down scores." Note the small improvement in 1995. "This was not caused by academic improvement. The test was restructured with less challenging vocabulary sections, and is simply easier overall. Add to that new scoring methods and you end up with scores that have no relation to the past." "According to the National Assessment of Educational Progress, barely 30 percent of 12th graders are proficient in either reading or history achievement." 'Grade School Quality', J. Allen, Richmond Times Dispatch, 9/31/96. Answer: instead of real improvements, they keep tinkering with design of the tests and calling for more funding. The above report shows redesigned verbal tests are less challenging. Other's report a 'dumbing-down' of the math SAT by reducing requirements for algebra, geometry and pure science, while passing out calculators so students must not even think for simple arithmetic. (and, we are inundated by theories designed not to solve problems but to explain them away, and by a fruitless debate over the proper interpretation of statistical data.). Its very sad!! For additional information see "Grading Standards". (there is also a link to that on the next page). |
2005 Testing
Were you suprised in 2005 when the National Assessment of Educational Progress (NAEP) reported that the testing of 300,000 students nation-wide showed that 82% of 12th grade students were not proficient in math and science - - even worse than 10 years earlier. 73% of 4th graders failed to gain proficiency scores. 8th graders showed no improvement in the past 10 years. (Imprimis, Feb. 2005, page 2)
Study after study, test after test - - Powerful evidence continues to prove that America's public education system is failing big-time regarding quality, compared to America's own past generations and compared to today's students in foreign nations.
2006
Were you surprised in 2006 to learn that 65% of 12-graders were not proficient in reading, a worse result than 1992 when the test was initiated. http://www.swissinfo.org/eng/view_from_america/index.html?siteSect=221
2007
Data released 4 December 2007 for the OECD PISA international test series in 2006 showed U.S.A. 15 year olds came in below average, at country ranking #29 in science and rank position #35 in math.
2009
Were you surprised in Sept. 2009 to learn > "Students in other countries are going to school 25, 30 percent longer than our students," Education Secretary Arne Duncan told the AP September 27, 2009. http://news.yahoo.com/s/ap/20090927/ap_on_re_us/us_more_school
Compared to other nations today
and compared to U.S. students 3 decades ago >
No Education Quality turn-around in sight !!
Competition can help reform our schoolsA VERY SENSIBLE REPORT |
| "It is time to stop fooling ourselves about government schools. They are
not doing the job the taxpayers are paying for and are unlikely to improve unless
education follows the example of business and engages in competition. With competition, the bad (schools) would change and the good ones would get even better. There's no such thing as outcome-based competition to make sure nobody's feelings get hurt. The real world is not a padded romper room at McDonald's." R. Lutz, President Chrysler Corporation [a link at bottom this page takes you to this powerful report] |
BOTTOM LINE:THE CLEAR ANSWER TO OUR OPENING QUESTIONS = NO !
Recommendations are on the next page, which may be summarized as: STOP ALL SOCIAL PROMOTION & GRADE INFLATION, REQUIRE WIDE USE OF SUMMER SCHOOLS WITH STUDENTS TO REPEAT THE GRADE IF STANDARD NOT ACHIEVED - - ESTABLISH TOUGH LOCAL STANDARDS FOR PERIODICALLY TESTING TEACHERS & STUDENTS (including use of international advanced exams and showing comparative US student performance vs. foreign students) WITH RESULTS OF EACH AVAILABLE TO PARENTS - - EXPOSE THE PUBLIC SYSTEM TO FREE-MARKET competition AND ACCOUNTABILITY - - CHARGE BACK TO HIGH SCHOOLS ALL COSTS OF COLLEGE REMEDIAL COURSES, INSTEAD OF TO STUDENT LOANS, PARENTS or PROPERTY TAXES - - ANNUALLY PUBLISH TO PUBLIC & PARENTS CURRENT AND PAST 20 YEAR SAT SCORES FOR READING & MATH FOR EACH SCHOOL - - DECOMMISSION PUBLIC TAX FUNDING OF SCHOOLS IN NON-COMPLIANCE. |
Page 2 of the main Education Report, with powerful Education articles and recommendations GO TO THE NEXT PAGE - - CLICK HERE |
Exchange information via E-mail to Michael HodgesConstructive input and links are welcome |
Invitation to visit the HOME PAGE of the GRANDFATHER ECONOMIC REPORTS - a collection of reports reviewing other difficult economic conditions facing young families and their children compared to prior generations |
| GO To TOP |
| Education Series Home & Contents | Economic Summary | Feedback | What's New | Link Index | Eye-opener |